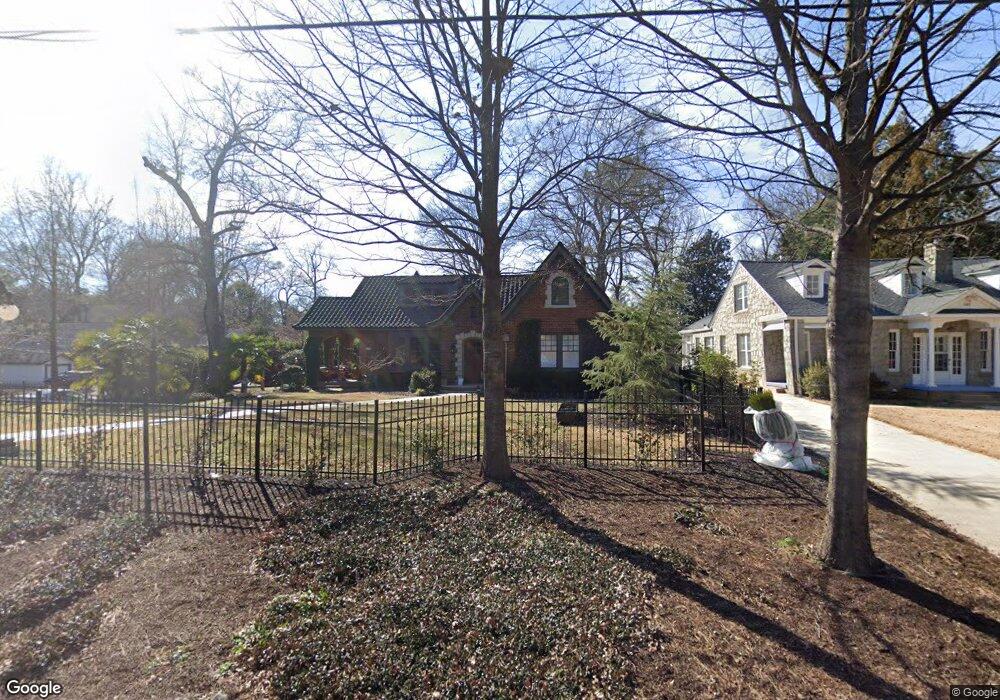
225 Cherokee Ave Athens, GA 30606
Five Points NeighborhoodEstimated Value: $1,132,000 - $1,565,446
2
Beds
2
Baths
3,996
Sq Ft
$351/Sq Ft
Est. Value
About This Home
This home is located at 225 Cherokee Ave, Athens, GA 30606 and is currently estimated at $1,403,482, approximately $351 per square foot. 225 Cherokee Ave is a home located in Clarke County with nearby schools including Barrow Elementary School, Clarke Middle School, and Clarke Central High School.
Ownership History
Date
Name
Owned For
Owner Type
Purchase Details
Closed on
Sep 9, 2021
Sold by
Yanosky Daniel J
Bought by
Carlyle Daniel Jerome and Carlyle Alex Marie
Current Estimated Value
Purchase Details
Closed on
May 7, 2009
Sold by
Mayfield Enterprises Inc
Bought by
Yanosky Daniel J
Home Financials for this Owner
Home Financials are based on the most recent Mortgage that was taken out on this home.
Original Mortgage
$296,703
Interest Rate
4.89%
Mortgage Type
FHA
Purchase Details
Closed on
Dec 8, 2008
Sold by
Holmes Lane
Bought by
Mayfield Enterprises Inc
Purchase Details
Closed on
Sep 8, 2008
Sold by
Ogg Cliveous R
Bought by
Ogg Cliveous R and Ogg Sherry Lynn
Purchase Details
Closed on
Sep 4, 2008
Sold by
Holmes Lane
Bought by
Ogg Cliveous R
Purchase Details
Closed on
Jan 15, 2008
Sold by
First American Bank & Tr
Bought by
Holmes Lane
Create a Home Valuation Report for This Property
The Home Valuation Report is an in-depth analysis detailing your home's value as well as a comparison with similar homes in the area
Home Values in the Area
Average Home Value in this Area
Purchase History
| Date | Buyer | Sale Price | Title Company |
|---|---|---|---|
| Carlyle Daniel Jerome | -- | -- | |
| Yanosky Daniel J | $324,000 | -- | |
| Mayfield Enterprises Inc | $220,000 | -- | |
| Ogg Cliveous R | -- | -- | |
| Ogg Cliveous R | $155,000 | -- | |
| Holmes Lane | $390,000 | -- |
Source: Public Records
Mortgage History
| Date | Status | Borrower | Loan Amount |
|---|---|---|---|
| Previous Owner | Yanosky Daniel J | $296,703 |
Source: Public Records
Tax History Compared to Growth
Tax History
| Year | Tax Paid | Tax Assessment Tax Assessment Total Assessment is a certain percentage of the fair market value that is determined by local assessors to be the total taxable value of land and additions on the property. | Land | Improvement |
|---|---|---|---|---|
| 2025 | $14,779 | $491,894 | $74,000 | $417,894 |
| 2024 | $14,779 | $554,891 | $74,000 | $480,891 |
| 2023 | $6,766 | $251,513 | $74,000 | $177,513 |
| 2022 | $6,280 | $206,852 | $70,000 | $136,852 |
| 2021 | $5,865 | $184,038 | $70,000 | $114,038 |
| 2020 | $5,904 | $175,192 | $70,000 | $105,192 |
| 2019 | $5,728 | $168,705 | $70,000 | $98,705 |
| 2018 | $5,087 | $149,834 | $70,000 | $79,834 |
| 2017 | $4,837 | $142,463 | $70,000 | $72,463 |
| 2016 | $4,616 | $135,976 | $70,000 | $65,976 |
| 2015 | $4,183 | $123,027 | $60,000 | $63,027 |
| 2014 | $3,915 | $114,964 | $54,000 | $60,964 |
Source: Public Records
Map
Nearby Homes
- 495 Woodlawn Ave
- 997 S Milledge Ave Unit 2
- 997 S Milledge Ave Unit 3
- 997 S Milledge Ave Unit 1
- 997 S Milledge Ave Unit 4
- 490 Mcwhorter Dr
- 577 W Cloverhurst Ave
- 275 Westview Dr
- 590 Highland Ave
- 2019 S Lumpkin St
- 265 Springdale St
- 221 University Dr
- 183 Parkway Dr
- 338 Springdale St
- 104 W Lake Ct
- 169 Fortson Cir
- 1055 Baxter St Unit 504
- 589 W Lake Dr
- 50 Springdale St
- 206 Fortson Dr
- 245 Cherokee Ave
- 183 Cherokee Ave
- 255 Cherokee Ave
- 159 Catawba Ave
- 160 Catawba Ave
- 124 Cherokee Ave
- 230 Cherokee Ave
- 230.5 Cherokee Ave
- 220 Cherokee Ave
- 290 Milledge Cir
- 161 Catawba Ave
- 121 Cherokee Ave
- 290.5 Milledge Cir
- 230 Cherokee Ave
- 275 Cherokee Ave
- 260 Cherokee Ave
- 165 Catawba Ave
- 0 Catawba Ave Unit 7444034
- 250 Cherokee Ave
- 115 Cherokee Ave