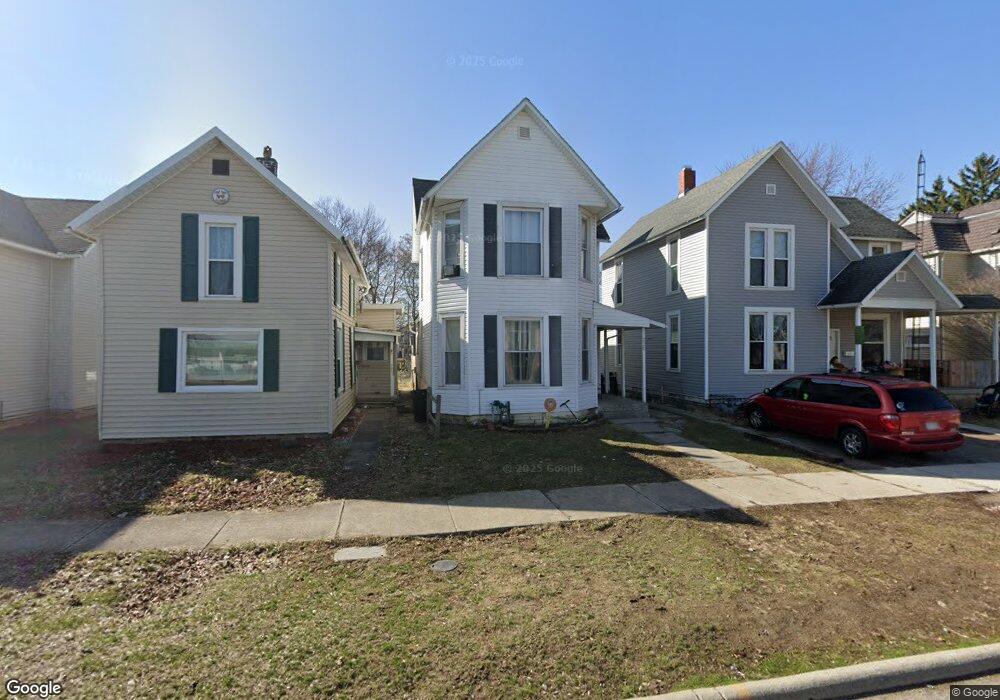
225 Cherry St Findlay, OH 45840
Estimated Value: $125,647 - $168,000
3
Beds
2
Baths
1,417
Sq Ft
$105/Sq Ft
Est. Value
About This Home
This home is located at 225 Cherry St, Findlay, OH 45840 and is currently estimated at $149,162, approximately $105 per square foot. 225 Cherry St is a home located in Hancock County with nearby schools including Whittier Primary School, Bigelow Hill Elementary School, and Glenwood Middle School.
Ownership History
Date
Name
Owned For
Owner Type
Purchase Details
Closed on
Feb 13, 2015
Sold by
Hancock Kevin and Steve Welton J
Bought by
Reiter Holdings Llc
Current Estimated Value
Purchase Details
Closed on
Oct 29, 2004
Sold by
El Zayaty Ahmed I and El Sherazy Hanaa
Bought by
Olmstead Kevin
Home Financials for this Owner
Home Financials are based on the most recent Mortgage that was taken out on this home.
Original Mortgage
$79,500
Interest Rate
5.79%
Mortgage Type
Unknown
Purchase Details
Closed on
Mar 16, 1993
Bought by
Guinn Jason E and Guinn Elida L
Purchase Details
Closed on
Jul 3, 1986
Bought by
Guinn Jason E and Guinn Elida L
Create a Home Valuation Report for This Property
The Home Valuation Report is an in-depth analysis detailing your home's value as well as a comparison with similar homes in the area
Home Values in the Area
Average Home Value in this Area
Purchase History
| Date | Buyer | Sale Price | Title Company |
|---|---|---|---|
| Reiter Holdings Llc | $25,000 | None Available | |
| Olmstead Kevin | $79,500 | -- | |
| Guinn Jason E | -- | -- | |
| Guinn Jason E | $26,600 | -- |
Source: Public Records
Mortgage History
| Date | Status | Borrower | Loan Amount |
|---|---|---|---|
| Previous Owner | Olmstead Kevin | $79,500 |
Source: Public Records
Tax History
| Year | Tax Paid | Tax Assessment Tax Assessment Total Assessment is a certain percentage of the fair market value that is determined by local assessors to be the total taxable value of land and additions on the property. | Land | Improvement |
|---|---|---|---|---|
| 2024 | $1,111 | $30,490 | $2,450 | $28,040 |
| 2023 | $1,113 | $30,490 | $2,450 | $28,040 |
| 2022 | $1,109 | $30,490 | $2,450 | $28,040 |
| 2021 | $1,063 | $25,440 | $2,580 | $22,860 |
| 2020 | $1,063 | $25,440 | $2,580 | $22,860 |
| 2019 | $1,042 | $25,440 | $2,580 | $22,860 |
| 2018 | $1,102 | $24,700 | $1,840 | $22,860 |
| 2017 | $551 | $24,700 | $1,840 | $22,860 |
| 2016 | $1,097 | $24,700 | $1,840 | $22,860 |
| 2015 | $1,022 | $17,630 | $2,210 | $15,420 |
| 2014 | $1,180 | $17,630 | $2,210 | $15,420 |
| 2012 | $797 | $15,740 | $2,210 | $13,530 |
Source: Public Records
Map
Nearby Homes
- 213 Cherry St
- 125 Cherry St
- 523 Center St
- 706 N Cory St
- 407 Washington St
- 204 Laquineo St
- 640 Center St
- 810 Mcconnell St
- 439 Carnahan Ave
- 514 Liberty St
- 206 Midland Ave
- 322 Midland Ave
- 301 Allen Ave
- 527 W Sandusky St
- 807 W Main Cross St
- 1020 Country Club Dr
- 829 Maple Ave
- 716 Winfield Ave
- 912 Parkside Place
- 1125 Glen Meadow Dr
Your Personal Tour Guide
Ask me questions while you tour the home.