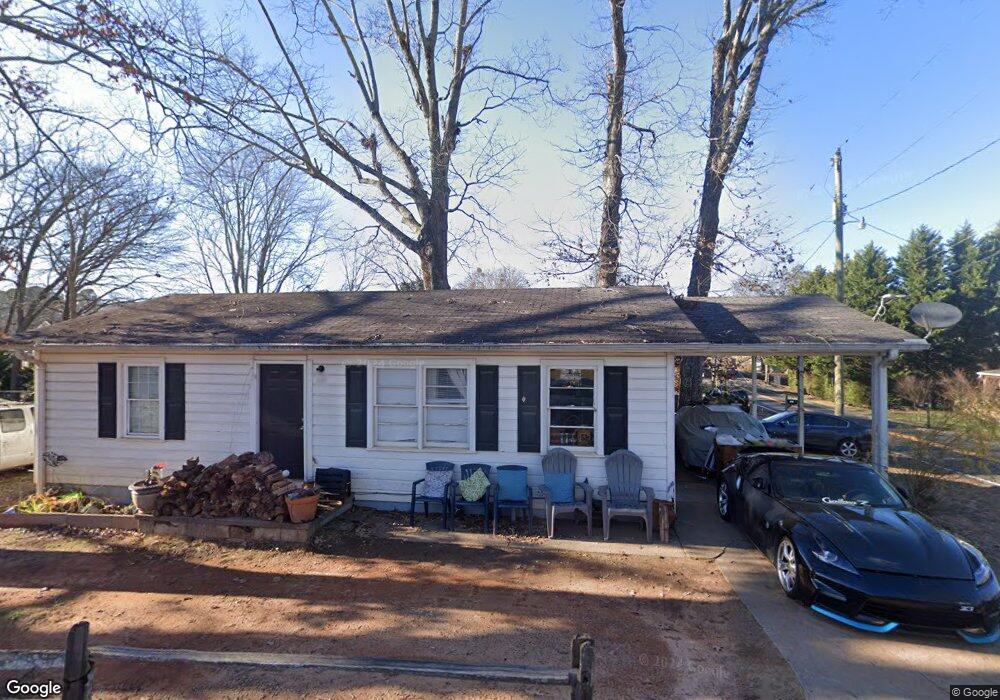
225 Cole St Buford, GA 30518
Estimated Value: $201,000 - $254,723
3
Beds
1
Bath
912
Sq Ft
$257/Sq Ft
Est. Value
About This Home
This home is located at 225 Cole St, Buford, GA 30518 and is currently estimated at $233,931, approximately $256 per square foot. 225 Cole St is a home located in Gwinnett County with nearby schools including Buford Elementary School, Buford Senior Academy, and Buford Academy.
Ownership History
Date
Name
Owned For
Owner Type
Purchase Details
Closed on
Aug 25, 2008
Sold by
Bonilla Jose M
Bought by
Bonilla Jose M and Bonilla Dalila A
Current Estimated Value
Purchase Details
Closed on
Jul 1, 2003
Sold by
Bolton Debora F
Bought by
Overby Nicholas S
Home Financials for this Owner
Home Financials are based on the most recent Mortgage that was taken out on this home.
Original Mortgage
$90,000
Interest Rate
6.24%
Create a Home Valuation Report for This Property
The Home Valuation Report is an in-depth analysis detailing your home's value as well as a comparison with similar homes in the area
Home Values in the Area
Average Home Value in this Area
Purchase History
| Date | Buyer | Sale Price | Title Company |
|---|---|---|---|
| Bonilla Jose M | $39,500 | -- | |
| Bonilla Jose M | $39,500 | -- | |
| Overby Nicholas S | $90,000 | -- |
Source: Public Records
Mortgage History
| Date | Status | Borrower | Loan Amount |
|---|---|---|---|
| Previous Owner | Overby Nicholas S | $90,000 |
Source: Public Records
Tax History Compared to Growth
Tax History
| Year | Tax Paid | Tax Assessment Tax Assessment Total Assessment is a certain percentage of the fair market value that is determined by local assessors to be the total taxable value of land and additions on the property. | Land | Improvement |
|---|---|---|---|---|
| 2025 | $1,039 | $72,400 | $40,000 | $32,400 |
| 2024 | $968 | $67,440 | $33,600 | $33,840 |
| 2023 | $968 | $52,840 | $26,000 | $26,840 |
| 2022 | $758 | $52,840 | $26,000 | $26,840 |
| 2021 | $464 | $32,360 | $16,800 | $15,560 |
| 2020 | $464 | $32,360 | $16,800 | $15,560 |
| 2019 | $419 | $32,360 | $16,800 | $15,560 |
| 2018 | $250 | $19,280 | $5,600 | $13,680 |
| 2016 | $247 | $19,280 | $5,600 | $13,680 |
| 2015 | $256 | $19,280 | $5,600 | $13,680 |
| 2014 | $246 | $18,240 | $5,600 | $12,640 |
Source: Public Records
Map
Nearby Homes
- 325 Church St
- 249 Cole St
- 270 Cole St
- 315 Church St
- 340 Church St
- 320 Church St
- 250 South St
- 260 Cole St
- 350 Church St
- 280 South St
- 4725 S Lee St
- 4715 S Lee St
- 445 Church St
- 285 S Church St
- 140 South St
- 0 South St Unit 8851585
- 0 South St Unit 8942022
- 0 South St Unit 8755190
- 0 South St Unit 8697741
- 0 South St