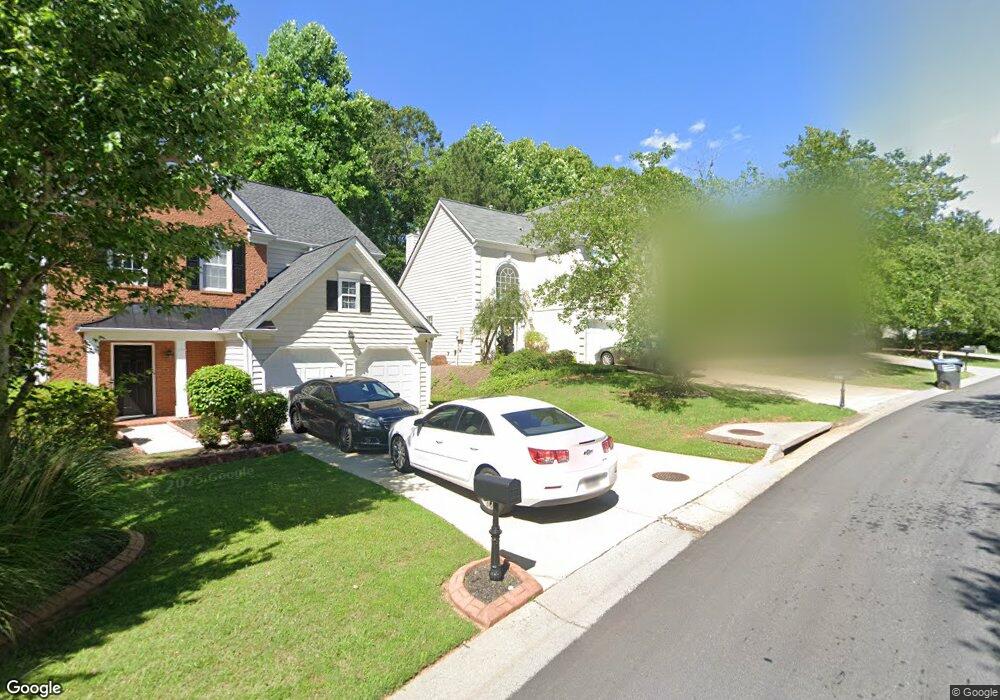
225 Colony Center Dr Unit U3 Woodstock, GA 30188
Estimated Value: $428,000 - $428,650
3
Beds
3
Baths
1,739
Sq Ft
$246/Sq Ft
Est. Value
About This Home
This home is located at 225 Colony Center Dr Unit U3, Woodstock, GA 30188 and is currently estimated at $428,325, approximately $246 per square foot. 225 Colony Center Dr Unit U3 is a home located in Cherokee County with nearby schools including Arnold Mill Elementary School, Mill Creek Middle School, and River Ridge High School.
Ownership History
Date
Name
Owned For
Owner Type
Purchase Details
Closed on
Sep 14, 2012
Sold by
Fisher Joannie M
Bought by
Fisher Joannie Marie
Current Estimated Value
Home Financials for this Owner
Home Financials are based on the most recent Mortgage that was taken out on this home.
Original Mortgage
$77,000
Outstanding Balance
$53,367
Interest Rate
3.68%
Mortgage Type
New Conventional
Estimated Equity
$374,958
Purchase Details
Closed on
Aug 26, 1999
Sold by
Hausfeld Judith E
Bought by
Fisher Joannie M
Home Financials for this Owner
Home Financials are based on the most recent Mortgage that was taken out on this home.
Original Mortgage
$92,450
Interest Rate
7.5%
Mortgage Type
New Conventional
Purchase Details
Closed on
Jan 7, 1997
Sold by
Batesville Const
Bought by
Hausfield Judith E
Create a Home Valuation Report for This Property
The Home Valuation Report is an in-depth analysis detailing your home's value as well as a comparison with similar homes in the area
Home Values in the Area
Average Home Value in this Area
Purchase History
| Date | Buyer | Sale Price | Title Company |
|---|---|---|---|
| Fisher Joannie Marie | $137,500 | -- | |
| Fisher Joannie M | $137,500 | -- | |
| Hausfield Judith E | $128,500 | -- |
Source: Public Records
Mortgage History
| Date | Status | Borrower | Loan Amount |
|---|---|---|---|
| Open | Fisher Joannie Marie | $77,000 | |
| Previous Owner | Fisher Joannie M | $92,450 |
Source: Public Records
Tax History Compared to Growth
Tax History
| Year | Tax Paid | Tax Assessment Tax Assessment Total Assessment is a certain percentage of the fair market value that is determined by local assessors to be the total taxable value of land and additions on the property. | Land | Improvement |
|---|---|---|---|---|
| 2025 | $3,590 | $157,324 | $35,200 | $122,124 |
| 2024 | $3,402 | $148,324 | $35,200 | $113,124 |
| 2023 | $2,673 | $134,320 | $30,000 | $104,320 |
| 2022 | $2,899 | $122,760 | $26,000 | $96,760 |
| 2021 | $2,695 | $103,520 | $20,000 | $83,520 |
| 2020 | $2,374 | $89,596 | $16,000 | $73,596 |
| 2019 | $2,332 | $87,800 | $16,000 | $71,800 |
| 2018 | $2,217 | $82,360 | $16,000 | $66,360 |
| 2017 | $2,089 | $190,500 | $16,000 | $60,200 |
| 2016 | $2,005 | $179,400 | $15,200 | $56,560 |
| 2015 | $1,874 | $165,100 | $12,800 | $53,240 |
| 2014 | $1,671 | $147,600 | $12,800 | $46,240 |
Source: Public Records
Map
Nearby Homes
- 223 Colony Center Dr
- 227 Colony Center Dr Unit 3
- 221 Colony Center Dr Unit 3
- 229 Colony Center Dr Unit 3
- 219 Colony Center Dr Unit 3
- 231 Colony Center Dr
- 3001 Ridgepoint Ln
- 3001 Ridgepoint Ln Unit 102
- 224 Colony Center Dr Unit 3
- 217 Colony Center Dr
- 233 Colony Center Dr
- 222 Colony Center Dr Unit 222
- 222 Colony Center Dr
- 3003 Ridgepoint Ln
- 220 Colony Center Dr
- 235 Colony Center Dr
- 3005 Ridgepoint Ln
- 215 Colony Center Dr Unit 69
- 215 Colony Center Dr
- 218 Colony Center Dr