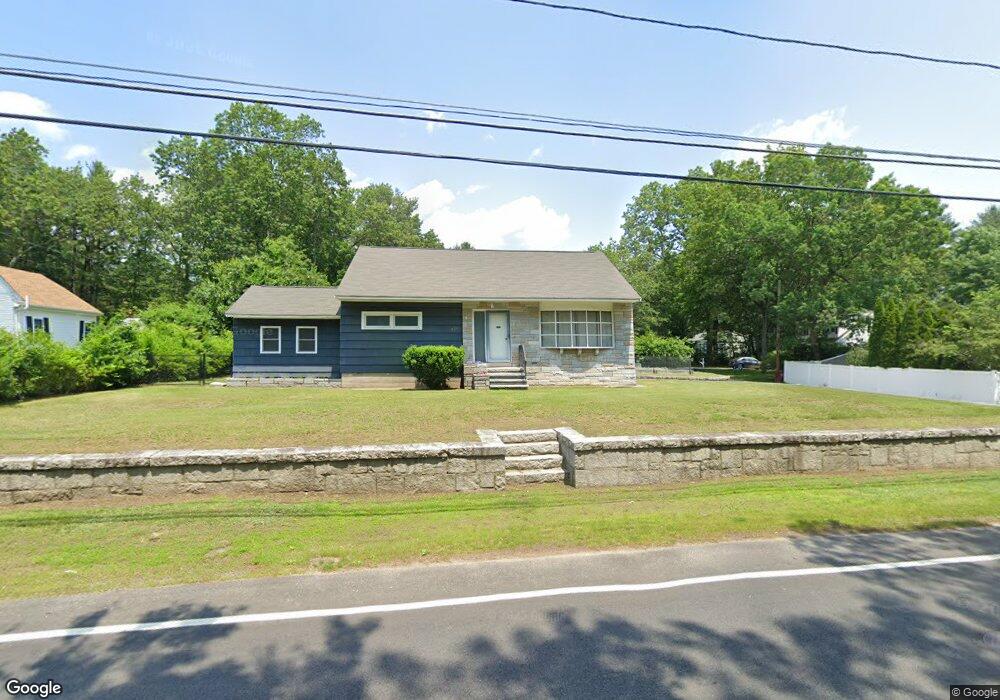
225 Dunstable Rd Tyngsboro, MA 01879
Estimated Value: $556,126 - $642,000
3
Beds
1
Bath
1,944
Sq Ft
$308/Sq Ft
Est. Value
About This Home
This home is located at 225 Dunstable Rd, Tyngsboro, MA 01879 and is currently estimated at $599,532, approximately $308 per square foot. 225 Dunstable Rd is a home located in Middlesex County with nearby schools including Tyngsborough Elementary School, Tyngsborough Middle School, and Innovation Academy Charter School.
Ownership History
Date
Name
Owned For
Owner Type
Purchase Details
Closed on
Jun 4, 2021
Sold by
Guilmette Alfred A
Bought by
Guilmette Alfred A and Guilmette Melissa
Current Estimated Value
Home Financials for this Owner
Home Financials are based on the most recent Mortgage that was taken out on this home.
Original Mortgage
$237,000
Outstanding Balance
$214,574
Interest Rate
2.9%
Mortgage Type
Stand Alone Refi Refinance Of Original Loan
Estimated Equity
$384,958
Purchase Details
Closed on
Jul 25, 2011
Sold by
Guilmette George
Bought by
Guilmette Ret and Guilmette
Purchase Details
Closed on
Sep 25, 2007
Sold by
Guilmette George
Bought by
George Guilmette Ret
Create a Home Valuation Report for This Property
The Home Valuation Report is an in-depth analysis detailing your home's value as well as a comparison with similar homes in the area
Home Values in the Area
Average Home Value in this Area
Purchase History
| Date | Buyer | Sale Price | Title Company |
|---|---|---|---|
| Guilmette Alfred A | -- | None Available | |
| Guilmette Alfred A | -- | None Available | |
| Guilmette Ret | -- | -- | |
| George Guilmette Ret | -- | -- | |
| Guilmette Ret | -- | -- | |
| George Guilmette Ret | -- | -- |
Source: Public Records
Mortgage History
| Date | Status | Borrower | Loan Amount |
|---|---|---|---|
| Open | Guilmette Alfred A | $237,000 | |
| Closed | Guilmette Alfred A | $237,000 | |
| Previous Owner | George Guilmette Ret | $216,000 |
Source: Public Records
Tax History Compared to Growth
Tax History
| Year | Tax Paid | Tax Assessment Tax Assessment Total Assessment is a certain percentage of the fair market value that is determined by local assessors to be the total taxable value of land and additions on the property. | Land | Improvement |
|---|---|---|---|---|
| 2025 | $53 | $432,800 | $193,400 | $239,400 |
| 2024 | $5,098 | $400,800 | $184,300 | $216,500 |
| 2023 | $4,897 | $346,300 | $153,300 | $193,000 |
| 2022 | $4,651 | $311,300 | $133,200 | $178,100 |
| 2021 | $12,196 | $280,600 | $120,400 | $160,200 |
| 2020 | $4,552 | $280,100 | $120,400 | $159,700 |
| 2019 | $4,414 | $260,700 | $114,900 | $145,800 |
| 2018 | $4,204 | $245,700 | $114,900 | $130,800 |
| 2017 | $4,124 | $240,300 | $114,900 | $125,400 |
| 2016 | $3,716 | $211,600 | $96,700 | $114,900 |
| 2015 | $3,589 | $211,600 | $96,700 | $114,900 |
Source: Public Records
Map
Nearby Homes
- 48 Mission Rd
- 5 Mission Rd Unit 203
- 180 Tyngsboro Rd Unit 3
- 1 Hope St
- 10 Worden Rd
- 863 Wellman Ave Unit 863
- 415 Wellman Ave
- 38 Scotty Hollow Dr Unit E
- 330 Wellman Ave
- 436 Wellman Ave
- 10 Butterfield St
- 126 Groton Rd
- 271 Wellman Ave
- 251 Wellman Ave Unit 251
- 348 Wellman Ave
- 739 Wellman Ave
- 30 Russell Rd
- 730 Wellman Ave
- 10 Mansur St
- 16 Middlesex St Unit 4
- 219 Dunstable Rd
- 229 Dunstable Rd
- 12 Cormier Ave
- 7 Cormier Ave
- 221 Dunstable Rd
- 224 Dunstable Rd
- 1 Hamblet Ave
- 217 Dunstable Rd
- 220 Dunstable Rd
- 10 Cormier Ave
- 228 Dunstable Rd
- 3 Cormier Ave
- 2 Hamblet Ave
- 5 Hamblet Ave
- 6 Hamblet Ave
- 232 Dunstable Rd
- 210 Dunstable Rd
- 4 Cormier Ave
- 10 Hamblet Ave
- 207 Dunstable Rd