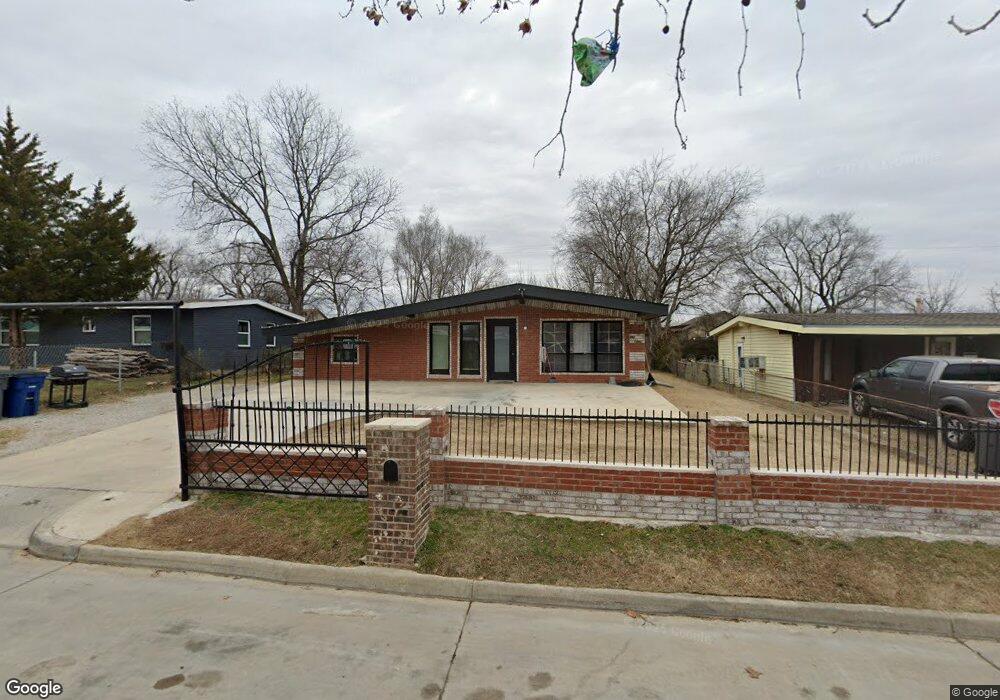
225 E 54th Place N Tulsa, OK 74126
Chamberlain NeighborhoodEstimated Value: $40,000 - $130,000
Studio
1
Bath
1,064
Sq Ft
$80/Sq Ft
Est. Value
About This Home
This home is located at 225 E 54th Place N, Tulsa, OK 74126 and is currently estimated at $85,299, approximately $80 per square foot. 225 E 54th Place N is a home located in Tulsa County with nearby schools including Monroe Demonstration Academy, McLain High School of Science and Technology, and Tulsa Legacy Charter School.
Ownership History
Date
Name
Owned For
Owner Type
Purchase Details
Closed on
Aug 28, 2024
Sold by
Esparza Teodoro Perez
Bought by
Perez Wendy A
Current Estimated Value
Purchase Details
Closed on
Dec 18, 2021
Sold by
Miranda Josefina Martinez
Bought by
Esparza Teodoro Perez
Purchase Details
Closed on
May 29, 2021
Sold by
Benitez Sanchez Yazmani
Bought by
Miranda Josefina Martinez
Purchase Details
Closed on
Jul 2, 2014
Sold by
Gutierrez Gilberto and Gutierrez Jacqueline
Bought by
Sanchez Yazmani Bentez and Benitez Brenda Pliego
Purchase Details
Closed on
Apr 14, 2014
Sold by
Tulsa County
Bought by
Gutierrez Jacqueline and Gutierrez Gilberto
Purchase Details
Closed on
Jun 19, 2013
Sold by
County Of Tulsa
Bought by
Tulsa County Board Of County Commissione
Purchase Details
Closed on
May 23, 2012
Sold by
Kirk Thomas G
Bought by
Tallent Anthony and Tallent Reynelda
Purchase Details
Closed on
Sep 1, 1986
Create a Home Valuation Report for This Property
The Home Valuation Report is an in-depth analysis detailing your home's value as well as a comparison with similar homes in the area
Home Values in the Area
Average Home Value in this Area
Purchase History
| Date | Buyer | Sale Price | Title Company |
|---|---|---|---|
| Perez Wendy A | $35,000 | None Listed On Document | |
| Esparza Teodoro Perez | $35,000 | None Listed On Document | |
| Miranda Josefina Martinez | $17,000 | None Listed On Document | |
| Sanchez Yazmani Bentez | $2,000 | None Available | |
| Gutierrez Jacqueline | $525 | None Available | |
| Tulsa County Board Of County Commissione | -- | None Available | |
| Tallent Anthony | -- | None Available | |
| -- | $33,000 | -- |
Source: Public Records
Tax History
| Year | Tax Paid | Tax Assessment Tax Assessment Total Assessment is a certain percentage of the fair market value that is determined by local assessors to be the total taxable value of land and additions on the property. | Land | Improvement |
|---|---|---|---|---|
| 2025 | $600 | $4,477 | $957 | $3,520 |
| 2024 | $346 | $2,862 | $734 | $2,128 |
| 2023 | $346 | $2,726 | $874 | $1,852 |
| 2022 | $346 | $2,596 | $957 | $1,639 |
| 2021 | $344 | $2,607 | $957 | $1,650 |
| 2020 | $340 | $2,607 | $957 | $1,650 |
| 2019 | $357 | $2,607 | $957 | $1,650 |
| 2018 | $358 | $2,607 | $957 | $1,650 |
| 2017 | $357 | $2,607 | $957 | $1,650 |
| 2016 | $350 | $2,607 | $957 | $1,650 |
| 2015 | $351 | $2,607 | $957 | $1,650 |
| 2014 | -- | $0 | $0 | $0 |
Source: Public Records
Map
Nearby Homes
- 241 E 53rd St N
- 414 E 54th St N
- 274 E 53rd St N
- 223 E 52nd St N
- 5439 N Frankfort Ave
- 552 E 55th Place N
- 0 N Cincinnati Place
- 658 E 53rd St N
- 5462 N Hartford Ave
- 10 E 50th Place N
- 5512 N Hartford Place
- 4697 N Boston Place
- 5234 N Kenosha Ave
- 5462 N Johnstown Ave
- 554 E 48th Place N
- 4680 N Boston Ave
- 557 E 59th St N
- 4604 N Boston Place
- 4842 N Johnstown Ave
- 4624 N Cheyenne Ave
- 231 E 54th Place N
- 221 E 54th Place N
- 226 E 55th St N
- 235 E 54th Place N
- 215 E 54th Place N
- 232 E 55th St N
- 220 E 55th St N
- 228 E 54th Place N
- 236 E 55th St N
- 224 E 54th Place N
- 216 E 55th St N
- 218 E 54th Place N
- 241 E 54th Place N
- 211 E 54th Place N
- 234 E 54th Place N
- 238 E 54th Place N
- 210 E 55th St N
- 214 E 54th Place N
- 245 E 54th Place N
- 205 E 54th Place N
Your Personal Tour Guide
Ask me questions while you tour the home.