Estimated Value: $248,000 - $321,000
Studio
--
Bath
1,320
Sq Ft
$207/Sq Ft
Est. Value
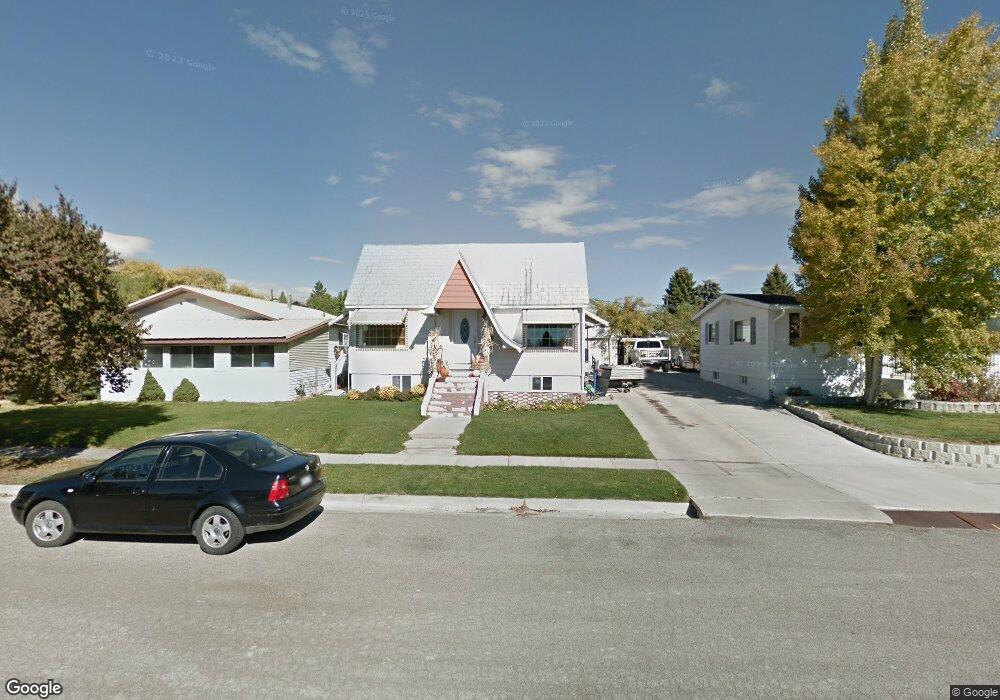
About This Home
This home is located at 225 E 800 N, Price, UT 84501 and is currently estimated at $273,407, approximately $207 per square foot. 225 E 800 N is a home located in Carbon County with nearby schools including Castle Heights School, Mont Harmon Junior High School, and Carbon High School.
Ownership History
Date
Name
Owned For
Owner Type
Purchase Details
Closed on
Oct 31, 2011
Sold by
Molinar Omar and Molinar Laurie
Bought by
Molinar Omar and Molinar Laurie
Current Estimated Value
Home Financials for this Owner
Home Financials are based on the most recent Mortgage that was taken out on this home.
Original Mortgage
$101,500
Outstanding Balance
$68,469
Interest Rate
3.95%
Estimated Equity
$204,938
Purchase Details
Closed on
Mar 17, 2008
Sold by
Federal Home Loan Mortgage Corporation
Bought by
Molinar Omar and Molinar Laurie
Home Financials for this Owner
Home Financials are based on the most recent Mortgage that was taken out on this home.
Original Mortgage
$100,000
Interest Rate
6.22%
Mortgage Type
New Conventional
Purchase Details
Closed on
Jul 5, 2007
Sold by
Marchello Brock J
Bought by
Green Point Mortgage Funding Inc
Create a Home Valuation Report for This Property
The Home Valuation Report is an in-depth analysis detailing your home's value as well as a comparison with similar homes in the area
Purchase History
We collect this data history from publicly available records. To have your information removed, we recommend requesting removal directly through your county’s website.
| Date | Buyer | Sale Price | Title Company |
|---|---|---|---|
| Molinar Omar | -- | -- | |
| Molinar Omar | $87,000 | None Available | |
| Green Point Mortgage Funding Inc | $93,334 | Professional Title Services |
Source: Public Records
Mortgage History
We collect this data history from publicly available records. To have your information removed, we recommend requesting removal directly through your county’s website.
| Date | Status | Borrower | Loan Amount |
|---|---|---|---|
| Open | Molinar Omar | $101,500 | |
| Previous Owner | Molinar Omar | $100,000 |
Source: Public Records
Tax History
| Year | Tax Paid | Tax Assessment Tax Assessment Total Assessment is a certain percentage of the fair market value that is determined by local assessors to be the total taxable value of land and additions on the property. | Land | Improvement |
|---|---|---|---|---|
| 2025 | $1,358 | $111,805 | $7,499 | $104,306 |
| 2024 | $1,403 | $116,773 | $9,075 | $107,698 |
| 2023 | $1,506 | $133,757 | $11,888 | $121,869 |
| 2022 | $1,574 | $125,394 | $9,884 | $115,510 |
| 2021 | $1,353 | $167,289 | $15,101 | $152,188 |
| 2020 | $1,327 | $82,357 | $0 | $0 |
| 2019 | $1,181 | $76,831 | $0 | $0 |
| 2018 | $1,119 | $74,241 | $0 | $0 |
| 2017 | $1,105 | $74,241 | $0 | $0 |
| 2016 | $997 | $74,241 | $0 | $0 |
| 2015 | $997 | $74,241 | $0 | $0 |
| 2014 | $990 | $74,241 | $0 | $0 |
| 2013 | $1,174 | $87,219 | $0 | $0 |
Source: Public Records
Map
Nearby Homes
Your Personal Tour Guide
Ask me questions while you tour the home.