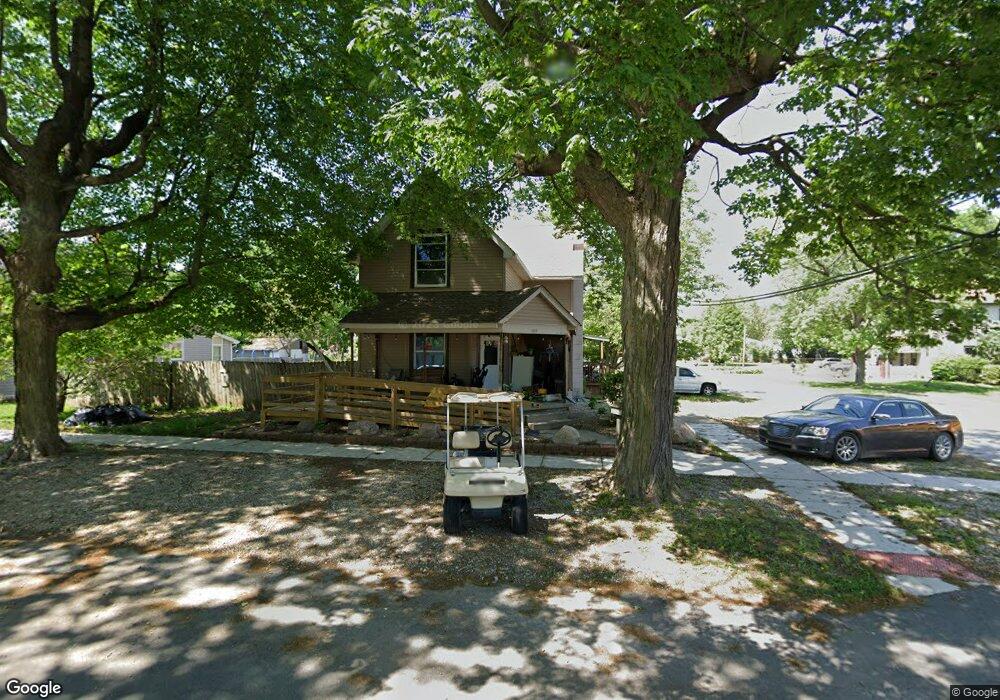
225 E Bow St Thorntown, IN 46071
Estimated Value: $90,000 - $231,000
3
Beds
1
Bath
1,736
Sq Ft
$92/Sq Ft
Est. Value
About This Home
This home is located at 225 E Bow St, Thorntown, IN 46071 and is currently estimated at $160,500, approximately $92 per square foot. 225 E Bow St is a home located in Boone County with nearby schools including Western Boone Junior/Senior High School.
Ownership History
Date
Name
Owned For
Owner Type
Purchase Details
Closed on
Dec 23, 2021
Sold by
Edwards Charles A
Bought by
Wright George A and Wright Julie A
Current Estimated Value
Home Financials for this Owner
Home Financials are based on the most recent Mortgage that was taken out on this home.
Original Mortgage
$134,300
Outstanding Balance
$123,304
Interest Rate
2.98%
Mortgage Type
New Conventional
Estimated Equity
$37,196
Purchase Details
Closed on
Jun 30, 2021
Sold by
Gillan Barry M
Bought by
Edwards Charles A
Purchase Details
Closed on
Dec 4, 2012
Sold by
Gillan Carrie A
Bought by
Gillan Barry M
Purchase Details
Closed on
Nov 3, 2005
Sold by
Gillan Barry M and King Carrie A
Bought by
Gillan Barry M and Gillan Carrie A
Home Financials for this Owner
Home Financials are based on the most recent Mortgage that was taken out on this home.
Original Mortgage
$85,874
Interest Rate
5.98%
Mortgage Type
New Conventional
Create a Home Valuation Report for This Property
The Home Valuation Report is an in-depth analysis detailing your home's value as well as a comparison with similar homes in the area
Purchase History
| Date | Buyer | Sale Price | Title Company |
|---|---|---|---|
| Wright George A | -- | Royal Title | |
| Edwards Charles A | -- | None Available | |
| Gillan Barry M | -- | None Available | |
| Gillan Barry M | -- | -- |
Source: Public Records
Mortgage History
| Date | Status | Borrower | Loan Amount |
|---|---|---|---|
| Open | Wright George A | $134,300 | |
| Previous Owner | Gillan Barry M | $85,874 |
Source: Public Records
Tax History
| Year | Tax Paid | Tax Assessment Tax Assessment Total Assessment is a certain percentage of the fair market value that is determined by local assessors to be the total taxable value of land and additions on the property. | Land | Improvement |
|---|---|---|---|---|
| 2025 | $1,312 | $85,800 | $14,200 | $71,600 |
| 2024 | $1,312 | $78,000 | $14,200 | $63,800 |
| 2023 | $1,284 | $73,100 | $14,200 | $58,900 |
| 2022 | $1,256 | $69,900 | $14,200 | $55,700 |
| 2021 | $1,229 | $142,300 | $15,900 | $126,400 |
| 2020 | $1,145 | $134,500 | $15,900 | $118,600 |
| 2019 | $1,083 | $131,100 | $15,900 | $115,200 |
| 2018 | $946 | $125,300 | $15,900 | $109,400 |
| 2017 | $514 | $90,800 | $15,900 | $74,900 |
| 2016 | $435 | $85,800 | $15,900 | $69,900 |
| 2014 | $329 | $78,400 | $15,900 | $62,500 |
| 2013 | $351 | $78,400 | $15,900 | $62,500 |
Source: Public Records
Map
Nearby Homes
- 307 S Market St
- 315 S Market St
- 6433 W State Road 47
- 5984 Stoney Brook Ln
- 6042 Whitney St
- 6139 Westfall Dr
- 5593 W 700 N
- 5571 W 700 N
- 6690 W Hazelrigg Rd
- 5158 N 1000 W
- 7001 N 1075 W
- 5388 W Hazelrigg Rd
- 6519 N 350 W
- 4535 N Us Hwy 52
- 3502 W 450 N
- 5000 N 275 W
- 5675 W 200 N
- 9000 W County Road 750 S
- 7820 W State Road 32
- 9002 W Sr 32
Your Personal Tour Guide
Ask me questions while you tour the home.