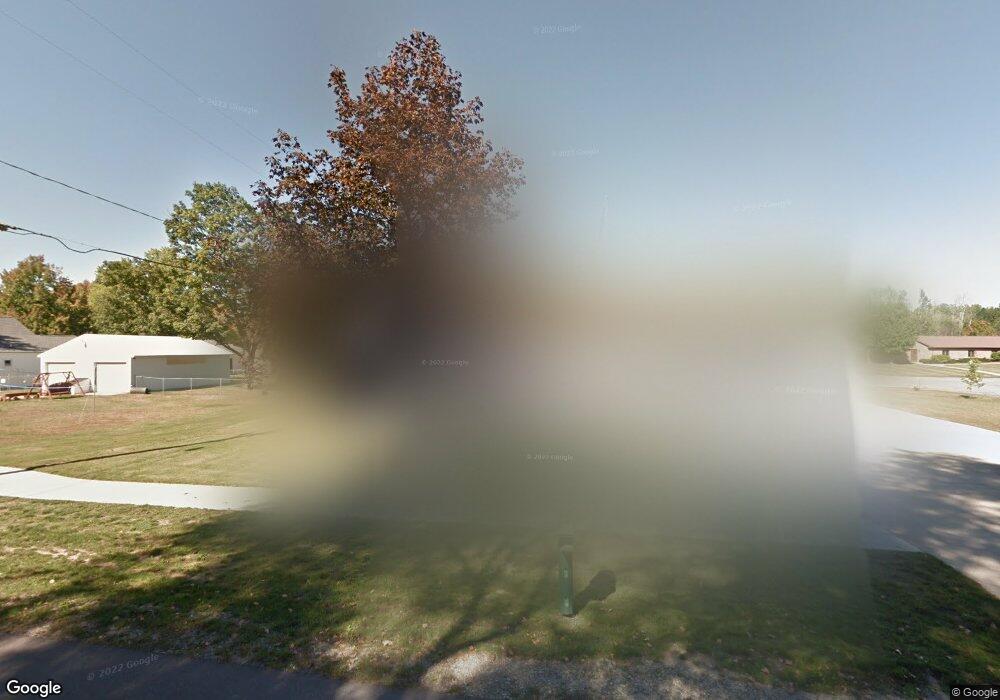
225 E Elm St Wayland, MI 49348
Estimated Value: $242,000 - $270,608
About This Home
This home is located at 225 E Elm St, Wayland, MI 49348 and is currently estimated at $259,152, approximately $228 per square foot. 225 E Elm St is a home located in Allegan County with nearby schools including Wayland High School and St. Therese Catholic School.
Ownership History
We collect this data history from publicly available records. To have your information removed, we recommend requesting removal directly through your county’s website.
Purchase Details
Purchase Details
Purchase Details
Purchase Details
Purchase Details
Home Financials for this Owner
Home Financials are based on the most recent Mortgage that was taken out on this home.Home Values in the Area
Average Home Value in this Area
Purchase History
We collect this data history from publicly available records. To have your information removed, we recommend requesting removal directly through your county’s website.
| Date | Buyer | Sale Price | Title Company |
|---|---|---|---|
| -- | -- | ||
| -- | -- | ||
| -- | None Available | ||
| -- | None Available | ||
| -- | Chicago Title |
Mortgage History
We collect this data history from publicly available records. To have your information removed, we recommend requesting removal directly through your county’s website.
| Date | Status | Borrower | Loan Amount |
|---|---|---|---|
| Previous Owner | $70,600 |
Tax History
We collect this data history from publicly available records. To have your information removed, we recommend requesting removal directly through your county’s website.
| Year | Tax Paid | Tax Assessment Tax Assessment Total Assessment is a certain percentage of the fair market value that is determined by local assessors to be the total taxable value of land and additions on the property. | Land | Improvement |
|---|---|---|---|---|
| 2025 | $2,157 | $107,200 | $21,100 | $86,100 |
| 2024 | $1,961 | $96,600 | $16,900 | $79,700 |
| 2023 | $1,961 | $76,200 | $15,400 | $60,800 |
| 2022 | $1,961 | $68,300 | $15,400 | $52,900 |
| 2020 | $1,834 | $59,500 | $14,300 | $45,200 |
| 2019 | $0 | $56,400 | $13,100 | $43,300 |
| 2018 | $0 | $52,200 | $13,100 | $39,100 |
| 2017 | $0 | $52,400 | $13,100 | $39,300 |
| 2016 | $0 | $42,700 | $10,700 | $32,000 |
| 2015 | -- | $42,700 | $10,700 | $32,000 |
| 2014 | -- | $38,800 | $10,700 | $28,100 |
| 2013 | -- | $37,100 | $10,700 | $26,400 |
Map
- 130 W Cherry St
- 545 N Main St
- 338 Park St
- 425 W Cherry St
- 603 W Maple St
- 312 Cedar St
- 321 Anderson Dr
- 518 Lawrence Ave Unit 5
- 520 Lawrence Ave
- 342 Lotz Ct
- 3569 Quebec Trail
- 3431 Ward Dr Unit 41
- 3286 Stonehill Ct
- 4225 Butternut Dr
- 861 132nd Ave
- 1245 138th Ave
- 575 135th Ave
- 3905 Sunset View
- 3214 7th St
- 703 140th Ave
Ask me questions while you tour the home.