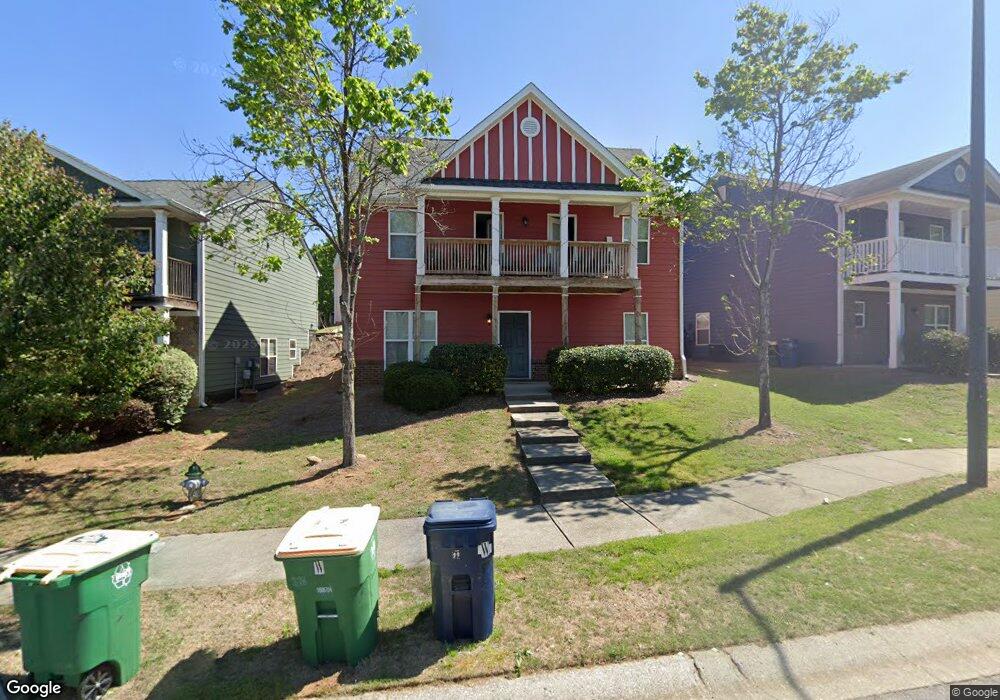
225 Fern Ridge Ct Athens, GA 30601
North Avenue NeighborhoodEstimated Value: $330,000 - $348,000
3
Beds
3
Baths
1,700
Sq Ft
$199/Sq Ft
Est. Value
About This Home
This home is located at 225 Fern Ridge Ct, Athens, GA 30601 and is currently estimated at $338,036, approximately $198 per square foot. 225 Fern Ridge Ct is a home located in Clarke County with nearby schools including Howard B. Stroud Elementary School, Coile Middle School, and Cedar Shoals High School.
Ownership History
Date
Name
Owned For
Owner Type
Purchase Details
Closed on
Jan 14, 2025
Sold by
Ajay Kumar Gupta Irrevocable Trust
Bought by
Lotusmoonlight #9 Llc
Current Estimated Value
Purchase Details
Closed on
Oct 31, 2019
Sold by
Salisbury Alley Llc
Bought by
Ajay Kumar Gupta Irrevocable Trust
Purchase Details
Closed on
Mar 7, 2018
Sold by
Phillips Garrett W
Bought by
Salisbury Alley Llc
Home Financials for this Owner
Home Financials are based on the most recent Mortgage that was taken out on this home.
Original Mortgage
$395,478
Interest Rate
4.32%
Mortgage Type
New Conventional
Purchase Details
Closed on
Feb 28, 2008
Sold by
Star Home Builders Inc
Bought by
Phillips Garrett W and Phillips Judith C
Home Financials for this Owner
Home Financials are based on the most recent Mortgage that was taken out on this home.
Original Mortgage
$138,852
Interest Rate
5.63%
Mortgage Type
FHA
Purchase Details
Closed on
Feb 1, 2007
Sold by
Not Provided
Bought by
Phillips Garrett W and Phillips
Create a Home Valuation Report for This Property
The Home Valuation Report is an in-depth analysis detailing your home's value as well as a comparison with similar homes in the area
Home Values in the Area
Average Home Value in this Area
Purchase History
| Date | Buyer | Sale Price | Title Company |
|---|---|---|---|
| Lotusmoonlight #9 Llc | -- | -- | |
| Ajay Kumar Gupta Irrevocable Trust | $590,000 | -- | |
| Salisbury Alley Llc | $145,000 | -- | |
| Phillips Garrett W | $144,000 | -- | |
| Phillips Garrett W | $40,000 | -- |
Source: Public Records
Mortgage History
| Date | Status | Borrower | Loan Amount |
|---|---|---|---|
| Previous Owner | Salisbury Alley Llc | $395,478 | |
| Previous Owner | Phillips Garrett W | $138,852 |
Source: Public Records
Tax History Compared to Growth
Tax History
| Year | Tax Paid | Tax Assessment Tax Assessment Total Assessment is a certain percentage of the fair market value that is determined by local assessors to be the total taxable value of land and additions on the property. | Land | Improvement |
|---|---|---|---|---|
| 2025 | $3,842 | $123,728 | $12,000 | $111,728 |
| 2024 | $3,842 | $119,594 | $12,000 | $107,594 |
| 2023 | $3,737 | $109,264 | $10,400 | $98,864 |
| 2022 | $2,986 | $93,599 | $10,400 | $83,199 |
| 2021 | $2,646 | $78,519 | $9,600 | $68,919 |
| 2020 | $1,978 | $62,000 | $9,600 | $52,400 |
| 2019 | $1,969 | $59,277 | $9,600 | $49,677 |
| 2018 | $1,910 | $56,263 | $9,600 | $46,663 |
| 2017 | $1,731 | $50,993 | $9,600 | $41,393 |
| 2016 | $1,652 | $48,657 | $9,600 | $39,057 |
| 2015 | $1,655 | $48,672 | $9,600 | $39,072 |
| 2014 | $1,703 | $50,024 | $9,600 | $40,424 |
Source: Public Records
Map
Nearby Homes
- 231 Fern Ridge Ct
- 219 Fern Ridge Ct
- 213 Fern Ridge Ct
- 237 Fern Ridge Ct
- 212 Katydid Dr
- 218 Katydid Dr
- 243 Fern Ridge Ct
- 206 Katydid Dr
- 207 Fern Ridge Ct
- 224 Katydid Dr
- 230 Fern Ridge Ct
- 224 Fern Ridge Ct
- 236 Fern Ridge Ct
- 218 Fern Ridge Ct
- 249 Fern Ridge Ct
- 242 Fern Ridge Ct
- 230 Katydid Dr
- 212 Fern Ridge Ct
- 1123 Katydid Dr
- 255 Fern Ridge Ct