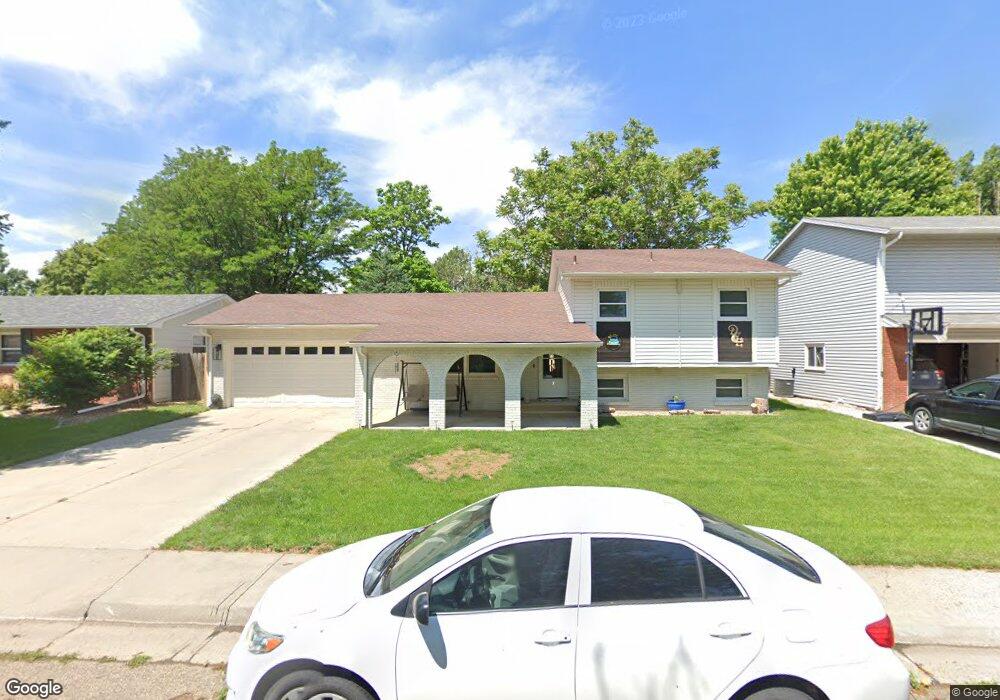
225 Gayle St Fort Morgan, CO 80701
Estimated Value: $353,133 - $384,000
4
Beds
2
Baths
1,952
Sq Ft
$188/Sq Ft
Est. Value
About This Home
This home is located at 225 Gayle St, Fort Morgan, CO 80701 and is currently estimated at $367,033, approximately $188 per square foot. 225 Gayle St is a home located in Morgan County with nearby schools including Fort Morgan High School and Lighthouse Seventh-day Adventist Christian School.
Ownership History
Date
Name
Owned For
Owner Type
Purchase Details
Closed on
Sep 8, 2021
Sold by
Corporate Properties Inc
Bought by
Roth Scott D and Roth Belinda Benuelos
Current Estimated Value
Home Financials for this Owner
Home Financials are based on the most recent Mortgage that was taken out on this home.
Original Mortgage
$315,000
Outstanding Balance
$286,627
Interest Rate
2.8%
Mortgage Type
New Conventional
Estimated Equity
$80,406
Purchase Details
Closed on
Mar 15, 2021
Sold by
Imhof Jacob and Graham Dean
Bought by
Corporate Proiproperties Inc
Purchase Details
Closed on
May 7, 2014
Sold by
Dones Mark and Dones Lawrence L
Bought by
Imhof Jacob and Graham Dean
Home Financials for this Owner
Home Financials are based on the most recent Mortgage that was taken out on this home.
Original Mortgage
$100,000
Interest Rate
4.43%
Mortgage Type
Purchase Money Mortgage
Create a Home Valuation Report for This Property
The Home Valuation Report is an in-depth analysis detailing your home's value as well as a comparison with similar homes in the area
Home Values in the Area
Average Home Value in this Area
Purchase History
| Date | Buyer | Sale Price | Title Company |
|---|---|---|---|
| Roth Scott D | $350,000 | Wfg National Title | |
| Corporate Proiproperties Inc | $145,000 | Wfg National Title | |
| Imhof Jacob | $125,000 | Nct |
Source: Public Records
Mortgage History
| Date | Status | Borrower | Loan Amount |
|---|---|---|---|
| Open | Roth Scott D | $315,000 | |
| Previous Owner | Imhof Jacob | $100,000 |
Source: Public Records
Tax History Compared to Growth
Tax History
| Year | Tax Paid | Tax Assessment Tax Assessment Total Assessment is a certain percentage of the fair market value that is determined by local assessors to be the total taxable value of land and additions on the property. | Land | Improvement |
|---|---|---|---|---|
| 2024 | $1,824 | $22,780 | $2,690 | $20,090 |
| 2023 | $1,824 | $26,460 | $3,130 | $23,330 |
| 2022 | $1,472 | $17,960 | $3,060 | $14,900 |
| 2021 | $1,516 | $18,480 | $3,150 | $15,330 |
| 2020 | $1,449 | $17,180 | $3,000 | $14,180 |
| 2019 | $1,451 | $17,180 | $3,000 | $14,180 |
| 2018 | $1,112 | $12,980 | $2,490 | $10,490 |
| 2017 | $1,114 | $12,980 | $2,490 | $10,490 |
| 2016 | $1,045 | $12,070 | $3,010 | $9,060 |
| 2015 | $1,030 | $12,070 | $3,010 | $9,060 |
| 2014 | $958 | $10,950 | $2,670 | $8,280 |
| 2013 | -- | $10,950 | $2,670 | $8,280 |
Source: Public Records
Map
Nearby Homes