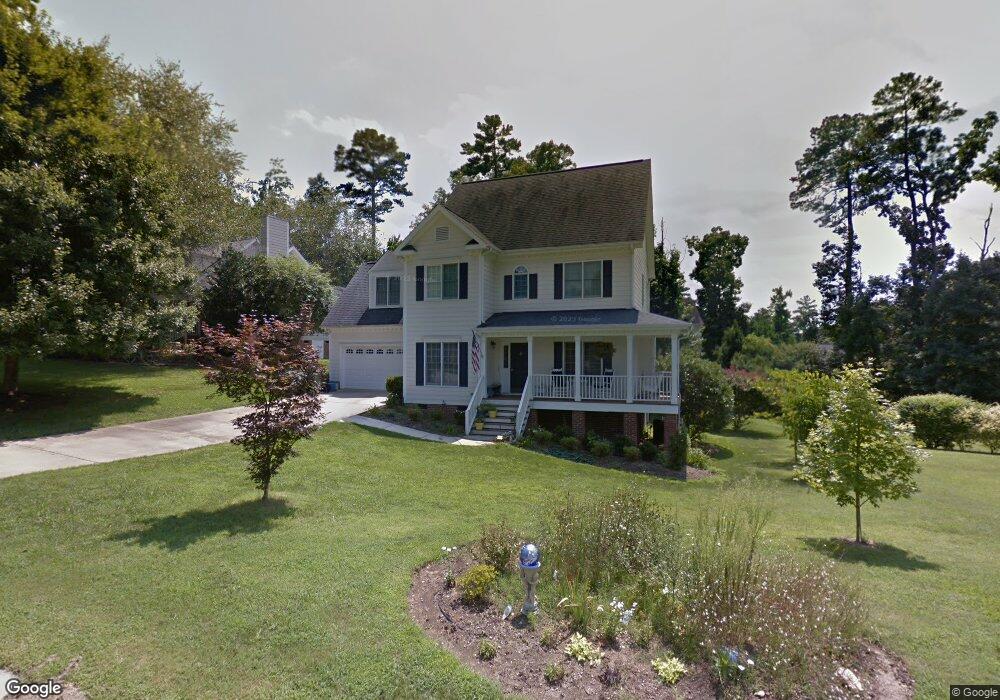
225 Hickory Glen Ln Holly Springs, NC 27540
Estimated Value: $462,000 - $493,000
3
Beds
3
Baths
2,166
Sq Ft
$223/Sq Ft
Est. Value
About This Home
This home is located at 225 Hickory Glen Ln, Holly Springs, NC 27540 and is currently estimated at $482,343, approximately $222 per square foot. 225 Hickory Glen Ln is a home located in Wake County with nearby schools including Holly Grove Elementary School, Holly Grove Middle School, and Holly Springs High School.
Ownership History
Date
Name
Owned For
Owner Type
Purchase Details
Closed on
May 22, 2014
Sold by
Altieri James L and Altieri Barbara A
Bought by
Ward Travis and Ward Kelley Ann
Current Estimated Value
Home Financials for this Owner
Home Financials are based on the most recent Mortgage that was taken out on this home.
Original Mortgage
$219,654
Outstanding Balance
$167,339
Interest Rate
4.32%
Mortgage Type
New Conventional
Estimated Equity
$315,004
Purchase Details
Closed on
Sep 21, 2001
Sold by
Hovey Scott Arthur and Hovey Suzanne
Bought by
Altieri James L and Altieri Barbara A
Home Financials for this Owner
Home Financials are based on the most recent Mortgage that was taken out on this home.
Original Mortgage
$146,400
Interest Rate
6.97%
Purchase Details
Closed on
Jan 2, 1998
Sold by
Heavenly Homes Kevin R Swartz Inc
Bought by
Hovey Scott Arthur and Hovey Suzanne Marie
Home Financials for this Owner
Home Financials are based on the most recent Mortgage that was taken out on this home.
Original Mortgage
$142,160
Interest Rate
9.5%
Create a Home Valuation Report for This Property
The Home Valuation Report is an in-depth analysis detailing your home's value as well as a comparison with similar homes in the area
Home Values in the Area
Average Home Value in this Area
Purchase History
| Date | Buyer | Sale Price | Title Company |
|---|---|---|---|
| Ward Travis | $241,000 | None Available | |
| Altieri James L | $183,000 | -- | |
| Hovey Scott Arthur | $178,000 | -- |
Source: Public Records
Mortgage History
| Date | Status | Borrower | Loan Amount |
|---|---|---|---|
| Open | Ward Travis | $219,654 | |
| Previous Owner | Altieri James L | $146,400 | |
| Previous Owner | Hovey Scott Arthur | $142,160 | |
| Closed | Hovey Scott Arthur | $17,700 |
Source: Public Records
Tax History Compared to Growth
Tax History
| Year | Tax Paid | Tax Assessment Tax Assessment Total Assessment is a certain percentage of the fair market value that is determined by local assessors to be the total taxable value of land and additions on the property. | Land | Improvement |
|---|---|---|---|---|
| 2025 | $3,844 | $444,302 | $115,000 | $329,302 |
| 2024 | $3,828 | $444,302 | $115,000 | $329,302 |
| 2023 | $3,432 | $316,313 | $52,000 | $264,313 |
| 2022 | $2,896 | $276,218 | $52,000 | $224,218 |
| 2021 | $2,842 | $276,218 | $52,000 | $224,218 |
| 2020 | $2,842 | $276,218 | $52,000 | $224,218 |
| 2019 | $2,804 | $231,382 | $52,000 | $179,382 |
| 2018 | $2,535 | $231,382 | $52,000 | $179,382 |
| 2017 | $2,444 | $231,382 | $52,000 | $179,382 |
| 2016 | $2,410 | $231,382 | $52,000 | $179,382 |
| 2015 | $2,469 | $233,310 | $52,000 | $181,310 |
| 2014 | $2,383 | $233,310 | $52,000 | $181,310 |
Source: Public Records
Map
Nearby Homes
- 233 Hickory Glen Ln
- 208 Autumn Glen Ln
- 161 Summit Oaks Ln
- 101 Covenant Rock Ln
- 100 Avent Pines Ln
- 1712 Avent Ferry Rd
- 933 Hollymont Dr
- 341 Covenant Rock Ln
- 300 Shorehouse Way
- 417 Shorehouse Way
- 213 Holly Moor Ln
- 100 Oakmoss Trail
- 304 Magnolia Meadow Way
- 505 Pyracantha Dr
- 0 Old Airport Rd
- 113 Braxman Ln
- 305 Martingale Dr
- 425 Cahors Trail
- 104 Pointe Park Cir
- 100 Sire Ct
- 221 Hickory Glen Ln
- 229 Hickory Glen Ln
- 216 High Maple Ct
- 220 High Maple Ct
- 217 Hickory Glen Ln
- 224 High Maple Ct
- 224 Hickory Glen Ln
- 212 High Maple Ct
- 220 Hickory Glen Ln
- 228 Hickory Glen Ln
- 236 Hickory Glen Ln
- 213 Hickory Glen Ln
- 216 Hickory Glen Ln
- 232 Hickory Glen Ln
- 228 High Maple Ct
- 208 High Maple Ct
- 209 High Maple Ct
- 209 Weatherbend Ct
- 209 Hickory Glen Ln
- 213 Weatherbend Ct