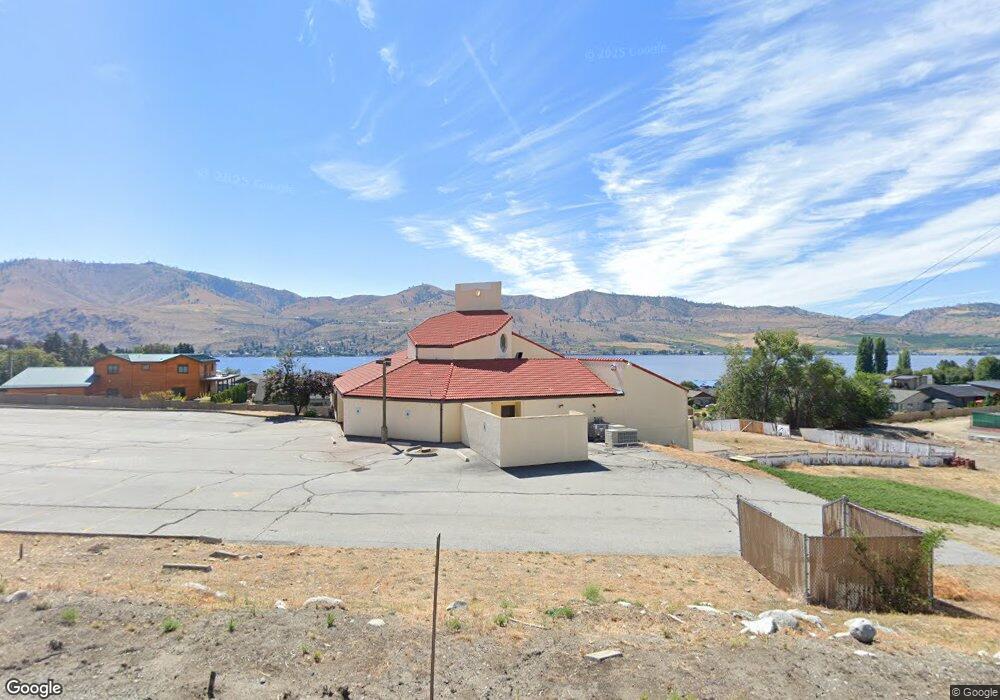
225 Highway 150 Chelan, WA 98816
Estimated Value: $1,880,398
--
Bed
--
Bath
5,400
Sq Ft
$348/Sq Ft
Est. Value
About This Home
This home is located at 225 Highway 150, Chelan, WA 98816 and is currently estimated at $1,880,398, approximately $348 per square foot. 225 Highway 150 is a home located in Chelan County with nearby schools including Morgen Owings Elementary School, Holden Village Community School, and Chelan Middle School.
Ownership History
Date
Name
Owned For
Owner Type
Purchase Details
Closed on
Feb 12, 2020
Sold by
Lozano Sergio and Delozano Ma De
Bought by
Bella Chelan Llc
Current Estimated Value
Purchase Details
Closed on
Aug 1, 2019
Sold by
Kenagy Robert D and Kenagy Roberta D
Bought by
Lozano Sergio and Lozano Ma Delourdes
Home Financials for this Owner
Home Financials are based on the most recent Mortgage that was taken out on this home.
Original Mortgage
$804,000
Interest Rate
3.73%
Mortgage Type
Seller Take Back
Purchase Details
Closed on
Mar 9, 2009
Sold by
Splash Properties Llc
Bought by
Kenagy Robert D and Kenagy Roberta D
Purchase Details
Closed on
Jul 13, 2005
Sold by
Kenagy Robert D and Kenagy Roberta D
Bought by
Splash Properties Llc
Home Financials for this Owner
Home Financials are based on the most recent Mortgage that was taken out on this home.
Original Mortgage
$1,000,000
Interest Rate
5.55%
Mortgage Type
Commercial
Create a Home Valuation Report for This Property
The Home Valuation Report is an in-depth analysis detailing your home's value as well as a comparison with similar homes in the area
Home Values in the Area
Average Home Value in this Area
Purchase History
| Date | Buyer | Sale Price | Title Company |
|---|---|---|---|
| Bella Chelan Llc | -- | None Available | |
| Lozano Sergio | $1,200,000 | North Meridian T&E | |
| Kenagy Robert D | -- | None Available | |
| Splash Properties Llc | $1,138,904 | First American Title Insuran |
Source: Public Records
Mortgage History
| Date | Status | Borrower | Loan Amount |
|---|---|---|---|
| Previous Owner | Lozano Sergio | $804,000 | |
| Previous Owner | Splash Properties Llc | $1,000,000 |
Source: Public Records
Tax History Compared to Growth
Tax History
| Year | Tax Paid | Tax Assessment Tax Assessment Total Assessment is a certain percentage of the fair market value that is determined by local assessors to be the total taxable value of land and additions on the property. | Land | Improvement |
|---|---|---|---|---|
| 2021 | $7,287 | $842,990 | $350,658 | $492,332 |
| 2020 | $6,334 | $864,205 | $350,658 | $513,547 |
| 2019 | $6,035 | $682,855 | $210,395 | $472,460 |
| 2018 | $7,021 | $667,842 | $210,395 | $457,447 |
| 2017 | $6,931 | $700,517 | $210,395 | $490,122 |
| 2016 | $7,160 | $739,127 | $210,395 | $528,732 |
| 2015 | $7,160 | $672,888 | $210,395 | $462,493 |
| 2013 | $7,160 | $635,460 | $210,395 | $425,065 |
Source: Public Records
Map
Nearby Homes
- 116 San Remo Ln
- 0 NNA Boyd Rd
- 231 Key Ln
- 235 Key Ln
- 217 San Remo Ln
- 131 Monte Carlo Dr
- 120 Orchard View Dr
- 100 Lake Chelan Shores Dr Unit 14-6 A
- 100 Lake Chelan Shores Dr Unit 3-6
- 100 Lake Chelan Shores Dr Unit 17-4C
- 100 Lake Chelan Shores Dr Unit 16-7&8
- 100 Lake Chelan Shores Dr Unit 16-4 P
- 100 Lake Chelan Shores Dr Unit 17-4 P
- 100 Lake Chelan Shores Dr Unit 19-2
- 100 Lake Chelan Shores Dr Unit 18-9
- 100 Lake Chelan Shores Dr Unit 17-1
- 100 Lake Chelan Shores Dr Unit 17-8J
- 200 Lord Acres Rd
- 212 Lord Acres Rd
- 204 Lord Acres Rd
- 225 Washington 150
- 104 S Lakeshore Rd
- 108 S Lakeshore Rd
- 104 N Shore Dr
- 108 N Shore Dr
- 112 N Shore Dr
- 158 Oasis Ln
- 116 N Shore Dr
- 116 S Lakeshore Rd
- 118 San Remo Ln
- 114 San Remo Ln
- 120 N Shore Dr
- 120 S Lakeshore Rd
- 105 S Lakeshore Rd
- 101 Monte Carlo Dr
- 101 S Lakeshore Rd
- 109 S Lakeshore Rd
- 101 N Shore Dr
- 105 N Shore Dr
- 109 N Shore Dr