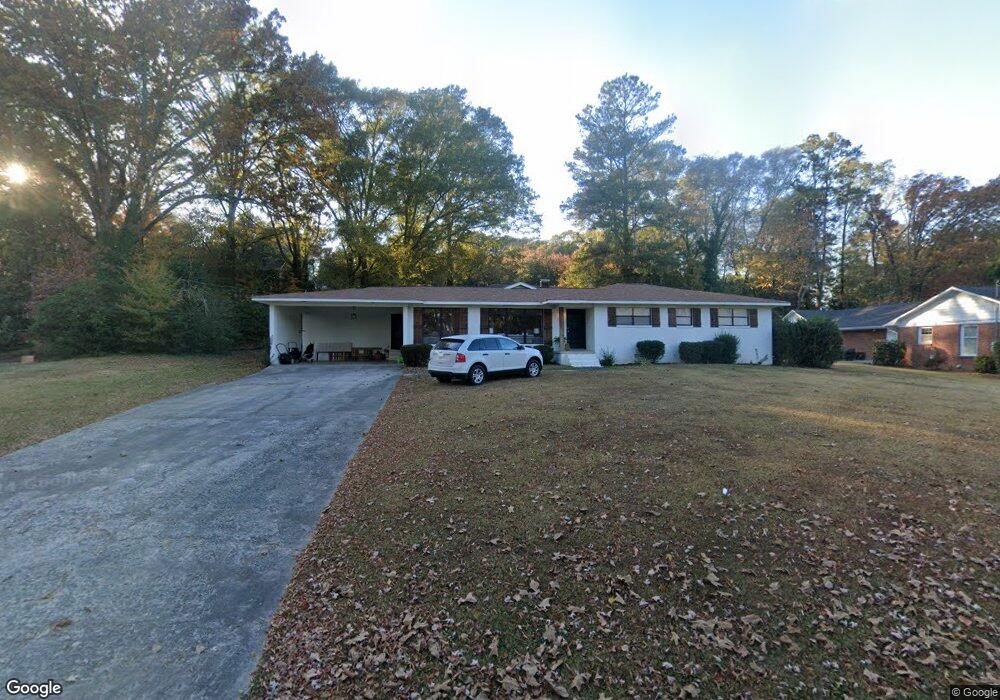
225 Hillcrest Dr Calhoun, GA 30701
Estimated Value: $272,000 - $357,000
4
Beds
2
Baths
2,301
Sq Ft
$144/Sq Ft
Est. Value
About This Home
This home is located at 225 Hillcrest Dr, Calhoun, GA 30701 and is currently estimated at $332,366, approximately $144 per square foot. 225 Hillcrest Dr is a home located in Gordon County with nearby schools including Calhoun Primary School, Calhoun Elementary School, and Calhoun Middle School.
Ownership History
Date
Name
Owned For
Owner Type
Purchase Details
Closed on
Jan 22, 2020
Sold by
Dobson Gary R
Bought by
Brown Carson Dakota and Brown Dalsy Carpenter
Current Estimated Value
Home Financials for this Owner
Home Financials are based on the most recent Mortgage that was taken out on this home.
Original Mortgage
$174,120
Interest Rate
3.74%
Mortgage Type
New Conventional
Purchase Details
Closed on
Jan 15, 2019
Sold by
Shelton Mary H Estate
Bought by
Dobson Gary R
Home Financials for this Owner
Home Financials are based on the most recent Mortgage that was taken out on this home.
Original Mortgage
$104,000
Interest Rate
4.6%
Mortgage Type
Commercial
Purchase Details
Closed on
Jun 30, 2009
Sold by
Shelton John D
Bought by
Shelton Mary H
Purchase Details
Closed on
May 11, 1964
Bought by
Shelton J John D
Create a Home Valuation Report for This Property
The Home Valuation Report is an in-depth analysis detailing your home's value as well as a comparison with similar homes in the area
Home Values in the Area
Average Home Value in this Area
Purchase History
| Date | Buyer | Sale Price | Title Company |
|---|---|---|---|
| Brown Carson Dakota | $155,000 | -- | |
| Dobson Gary R | $130,000 | -- | |
| Shelton Mary H | -- | -- | |
| Shelton J John D | -- | -- |
Source: Public Records
Mortgage History
| Date | Status | Borrower | Loan Amount |
|---|---|---|---|
| Closed | Brown Carson Dakota | $174,120 | |
| Previous Owner | Dobson Gary R | $104,000 |
Source: Public Records
Tax History Compared to Growth
Tax History
| Year | Tax Paid | Tax Assessment Tax Assessment Total Assessment is a certain percentage of the fair market value that is determined by local assessors to be the total taxable value of land and additions on the property. | Land | Improvement |
|---|---|---|---|---|
| 2024 | $3,018 | $107,360 | $7,600 | $99,760 |
| 2023 | $2,805 | $99,760 | $7,600 | $92,160 |
| 2022 | $882 | $92,720 | $7,600 | $85,120 |
| 2021 | $1,846 | $73,560 | $5,600 | $67,960 |
| 2020 | $1,523 | $50,760 | $11,200 | $39,560 |
| 2019 | $1,521 | $50,760 | $11,200 | $39,560 |
| 2018 | $426 | $46,200 | $11,200 | $35,000 |
| 2017 | $413 | $44,040 | $11,200 | $32,840 |
| 2016 | $414 | $44,040 | $11,200 | $32,840 |
| 2015 | $410 | $43,280 | $11,200 | $32,080 |
| 2014 | $393 | $42,273 | $11,200 | $31,073 |
Source: Public Records
Map
Nearby Homes
- 229 Hillcrest Dr
- 136 Boston Rd
- 198 Hillcrest Dr
- 107 Bobwhite Dr
- 105 Bobwhite Dr
- 104 Bobwhite Dr
- 110 Boston Rd
- 0 N Dale Ave Unit 7622794
- 0 N Dale Ave Unit 10572875
- 212 Sherwood Dr
- 421 Boulevard Heights
- 156 Fair Oak Ln
- 162 Oakleigh Ct
- 187 Asbury Cir
- 1208 Jewel Ct
- 173 Oakleigh Dr
- 0 Resaca Lafayette Rd Unit 7113987
- 00 Resaca Lafayette Rd
- 133 Asbury Cir
- 1401 Ga-53
- 225 Hillcrest Dr
- 230 Valley Cir
- 223 Hillcrest Dr
- 227 Hillcrest Dr
- 214 Victory Dr
- 212 Victory Dr
- 221 Hillcrest Dr
- 224 Hillcrest Dr
- 216 Victory Dr
- 226 Hillcrest Dr
- 219 Hillcrest Dr
- 113 Valley Cir
- 124 Valley Cir
- 218 Victory Dr
- 231 Hillcrest Dr
- 215 Victory Dr
- 217 Hillcrest Dr
- 216 Hillcrest Dr
- 230 Hillcrest Dr
- 213 Victory Dr