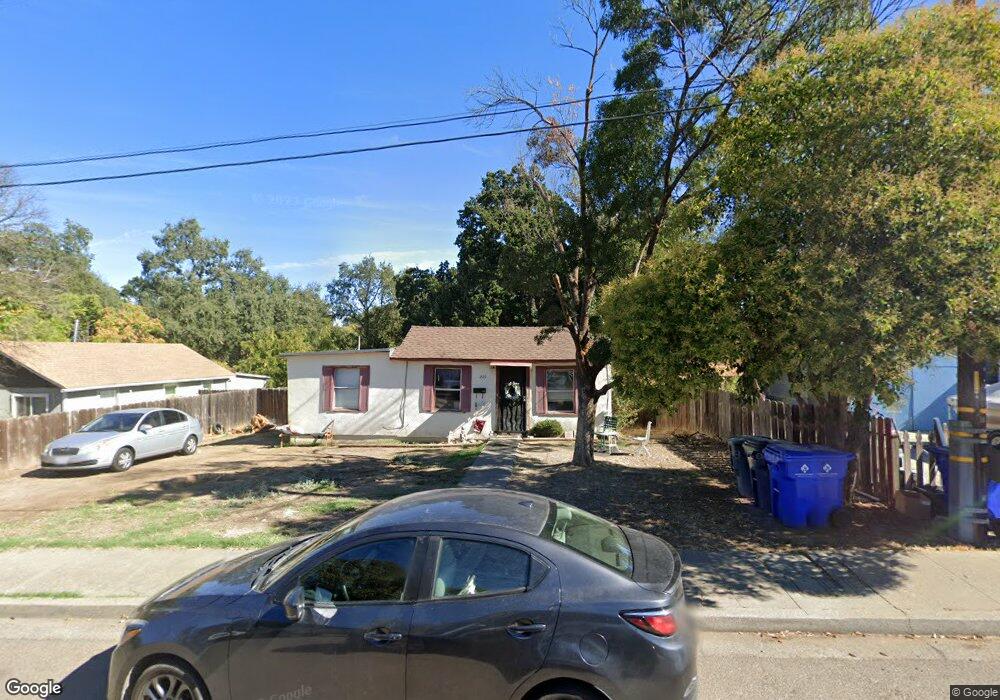
225 James Ave Red Bluff, CA 96080
Red Bluff AreaEstimated Value: $169,789 - $218,000
About This Home
This home is located at 225 James Ave, Red Bluff, CA 96080 and is currently estimated at $186,697, approximately $219 per square foot. 225 James Ave is a home located in Tehama County with nearby schools including Jackson Heights Elementary School, Vista Preparatory Academy, and Red Bluff High School.
Ownership History
We collect this data history from publicly available records. To have your information removed, we recommend requesting removal directly through your county’s website.
Purchase Details
Purchase Details
Purchase Details
Home Financials for this Owner
Home Financials are based on the most recent Mortgage that was taken out on this home.Purchase History
We collect this data history from publicly available records. To have your information removed, we recommend requesting removal directly through your county’s website.
| Date | Buyer | Sale Price | Title Company |
|---|---|---|---|
| -- | None Available | ||
| $58,000 | Placer Title Company | ||
| -- | Fidelity National Title Comp |
Mortgage History
We collect this data history from publicly available records. To have your information removed, we recommend requesting removal directly through your county’s website.
| Date | Status | Borrower | Loan Amount |
|---|---|---|---|
| Previous Owner | $225,000 | ||
| Previous Owner | $142,500 |
Tax History
We collect this data history from publicly available records. To have your information removed, we recommend requesting removal directly through your county’s website.
| Year | Tax Paid | Tax Assessment Tax Assessment Total Assessment is a certain percentage of the fair market value that is determined by local assessors to be the total taxable value of land and additions on the property. | Land | Improvement |
|---|---|---|---|---|
| 2025 | $684 | $73,876 | $36,938 | $36,938 |
| 2023 | $671 | $71,008 | $35,504 | $35,504 |
| 2022 | $665 | $69,616 | $34,808 | $34,808 |
| 2021 | $637 | $68,252 | $34,126 | $34,126 |
| 2020 | $649 | $67,554 | $33,777 | $33,777 |
| 2019 | $652 | $66,230 | $33,115 | $33,115 |
| 2018 | $602 | $64,932 | $32,466 | $32,466 |
| 2017 | $621 | $63,660 | $31,830 | $31,830 |
| 2016 | $635 | $62,412 | $31,206 | $31,206 |
| 2015 | -- | $61,476 | $30,738 | $30,738 |
| 2014 | $616 | $60,272 | $30,136 | $30,136 |
Map
- 322 Jackson St
- 226 Madison St
- 818 Olive St
- 406 S Jackson St
- 635 Armstrong Ct
- 421 Lincoln St
- 735 Reeds Ave Unit 737 & 739 Reeds Aven
- 735 Reeds Ave
- 420 Griffin Way
- 1002 Franzel Rd
- 415 Homestead Dr
- 815 Cascade Ave
- 0 Jefferson St Unit SN26036140
- 728 Lincoln St
- 195 Howell Ave
- 275 Howell Ave
- 1307 Deborah Dr
- 655 Wernmark Dr
- 855 Jackson St
- 701 Rio St
- 230 James Ave
- 717 Musick Ave
- 240 James Ave
- 246 James Ave
- 725 Musick Ave
- 245 Kay Ave
- 235 Kay Ave Unit 235 1/2 Kay Ave
- 235 Kay Ave
- 215 James Ave
- 250 James Ave
- 235 James Ave
- 205 James Ave
- 255 Kay Ave
- 722 Musick Ave
- 716 Musick Ave
- 237 James Ave
- 728 Musick Ave
- 199 James Ave
- 260 James Ave Unit James Ave
- 260 James Ave
Ask me questions while you tour the home.