Estimated Value: $314,370 - $346,000
3
Beds
2
Baths
1,479
Sq Ft
$224/Sq Ft
Est. Value
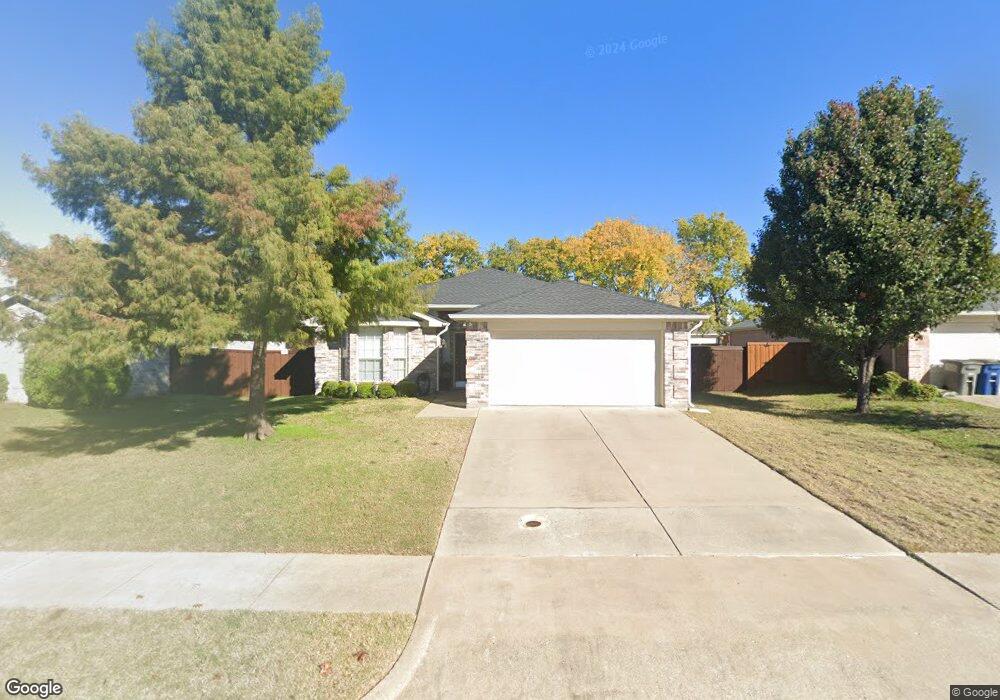
About This Home
This home is located at 225 Lake Travis Dr, Wylie, TX 75098 and is currently estimated at $330,593, approximately $223 per square foot. 225 Lake Travis Dr is a home located in Collin County with nearby schools including Wally Watkins Elementary School, AB Harrison Intermediate School, and Grady Burnett J High School.
Ownership History
Date
Name
Owned For
Owner Type
Purchase Details
Closed on
Aug 20, 2012
Sold by
Read John and Read Amanda Robinson
Bought by
Young Gary L and Young Deborah L
Current Estimated Value
Home Financials for this Owner
Home Financials are based on the most recent Mortgage that was taken out on this home.
Original Mortgage
$99,920
Outstanding Balance
$69,090
Interest Rate
3.63%
Estimated Equity
$261,503
Purchase Details
Closed on
Aug 17, 2001
Sold by
Choice Homes Inc
Bought by
Read John and Read Amanda Robison
Home Financials for this Owner
Home Financials are based on the most recent Mortgage that was taken out on this home.
Original Mortgage
$114,136
Interest Rate
7.16%
Purchase Details
Closed on
Apr 17, 2001
Sold by
Twin Lakes Lp
Bought by
Choice Homes Inc
Home Financials for this Owner
Home Financials are based on the most recent Mortgage that was taken out on this home.
Original Mortgage
$10,000,000
Interest Rate
6.93%
Create a Home Valuation Report for This Property
The Home Valuation Report is an in-depth analysis detailing your home's value as well as a comparison with similar homes in the area
Home Values in the Area
Average Home Value in this Area
Purchase History
| Date | Buyer | Sale Price | Title Company |
|---|---|---|---|
| Young Gary L | -- | Lawyers Title | |
| Read John | -- | -- | |
| Choice Homes Inc | -- | -- |
Source: Public Records
Mortgage History
| Date | Status | Borrower | Loan Amount |
|---|---|---|---|
| Open | Young Gary L | $99,920 | |
| Previous Owner | Read John | $114,136 | |
| Previous Owner | Choice Homes Inc | $10,000,000 |
Source: Public Records
Tax History Compared to Growth
Tax History
| Year | Tax Paid | Tax Assessment Tax Assessment Total Assessment is a certain percentage of the fair market value that is determined by local assessors to be the total taxable value of land and additions on the property. | Land | Improvement |
|---|---|---|---|---|
| 2025 | $6,488 | $327,478 | $90,000 | $237,478 |
| 2024 | $6,488 | $328,516 | $80,000 | $248,516 |
| 2023 | $6,488 | $317,116 | $80,000 | $237,116 |
| 2022 | $6,268 | $285,689 | $80,000 | $205,689 |
| 2021 | $5,305 | $225,453 | $60,000 | $165,453 |
| 2020 | $5,294 | $213,196 | $60,000 | $153,196 |
| 2019 | $5,678 | $216,056 | $60,000 | $156,056 |
| 2018 | $5,350 | $198,671 | $50,000 | $148,671 |
| 2017 | $4,916 | $182,549 | $45,000 | $137,549 |
| 2016 | $4,413 | $158,826 | $33,000 | $125,826 |
| 2015 | $3,628 | $141,422 | $33,000 | $108,422 |
Source: Public Records
Map
Nearby Homes
- 1306 Angel Fire Dr
- 217 Cloudcroft Dr
- 314 Lake Texoma Dr
- 800 Twin Oaks Dr
- 203 Forestbrook Dr
- 226 Shadybrook Dr
- 414 Briarwood Dr
- 416 S 1st St
- 401 Willow Way
- 307 Memorial Dr
- 407 Stoneybrook Dr
- 406 Willow Way
- 702 S Ballard Ave
- 416 Dogwood Dr
- Oakhaven Plan at Alanis Crossing
- Valencia Plan at Alanis Crossing
- 327 S 4th St
- 109 Rockbrook Dr
- 329 S 2nd St
- 603 Valentine Ln
- 227 Lake Travis Dr
- 223 Lake Travis Dr
- 229 Lake Travis Dr
- 221 Lake Travis Dr
- 230 Silvercreek Dr
- 228 Silvercreek Dr
- 232 Silvercreek Dr
- 222 Lake Travis Dr
- 220 Lake Travis Dr
- 231 Lake Travis Dr
- 219 Lake Travis Dr
- 226 Silvercreek Dr
- 224 Lake Travis Dr
- 218 Lake Travis Dr
- 234 Silvercreek Dr
- 226 Lake Travis Dr
- 224 Silvercreek Dr
- 233 Lake Travis Dr
- 216 Lake Travis Dr
- 217 Lake Travis Dr