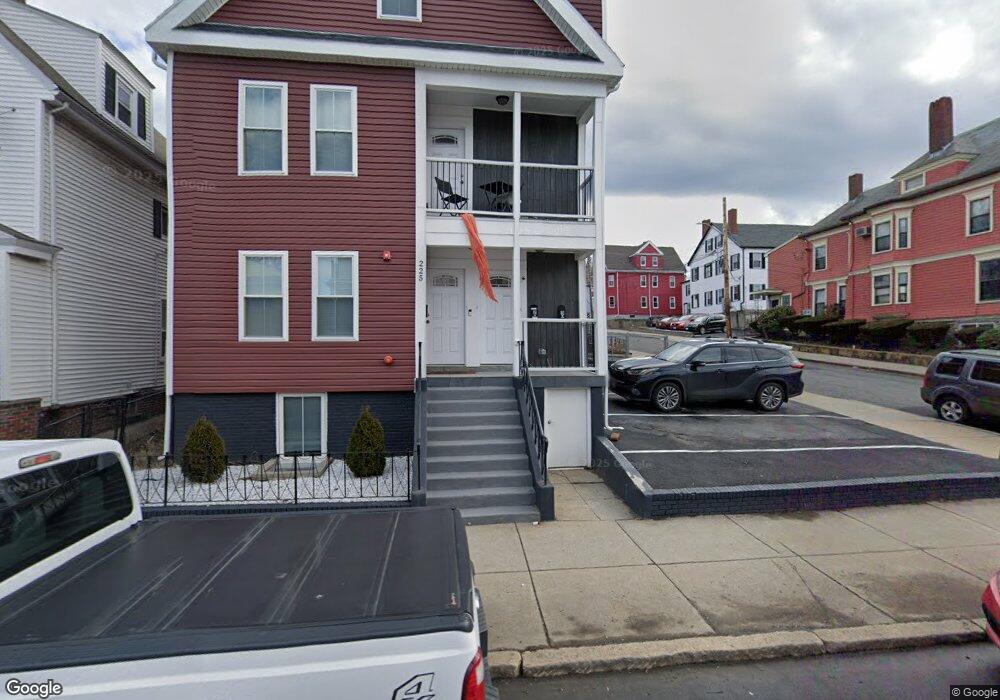
225 Main St Everett, MA 02149
West Everett NeighborhoodEstimated Value: $679,500
1
Bed
3
Baths
685
Sq Ft
$992/Sq Ft
Est. Value
About This Home
This home is located at 225 Main St, Everett, MA 02149 and is currently priced at $679,500, approximately $991 per square foot. 225 Main St is a home located in Middlesex County with nearby schools including Everett High School, Pioneer Charter School of Science, and St Anthony School.
Ownership History
Date
Name
Owned For
Owner Type
Purchase Details
Closed on
Feb 23, 2021
Sold by
Qs Private Lending Llc
Bought by
Zhou Dandan
Current Estimated Value
Home Financials for this Owner
Home Financials are based on the most recent Mortgage that was taken out on this home.
Original Mortgage
$302,933
Outstanding Balance
$270,940
Interest Rate
2.7%
Mortgage Type
Purchase Money Mortgage
Purchase Details
Closed on
Dec 28, 2020
Sold by
Qs Private Lending Llc
Bought by
Gallagher Lauren
Home Financials for this Owner
Home Financials are based on the most recent Mortgage that was taken out on this home.
Original Mortgage
$302,933
Outstanding Balance
$270,940
Interest Rate
2.7%
Mortgage Type
Purchase Money Mortgage
Purchase Details
Closed on
Dec 21, 2020
Sold by
225 Main Lending T
Bought by
Smith Serena H and Deng Zhisheng
Home Financials for this Owner
Home Financials are based on the most recent Mortgage that was taken out on this home.
Original Mortgage
$356,000
Interest Rate
2.71%
Mortgage Type
Purchase Money Mortgage
Purchase Details
Closed on
Nov 9, 2017
Sold by
North Anne M
Bought by
225 Main Street Llc
Home Financials for this Owner
Home Financials are based on the most recent Mortgage that was taken out on this home.
Original Mortgage
$790,000
Interest Rate
3.83%
Mortgage Type
Unknown
Purchase Details
Closed on
Mar 17, 1997
Sold by
Devitto Joseph F and Devitto Richard M
Bought by
North Anne M and North Elmer E
Home Financials for this Owner
Home Financials are based on the most recent Mortgage that was taken out on this home.
Original Mortgage
$85,000
Interest Rate
7.79%
Mortgage Type
Purchase Money Mortgage
Create a Home Valuation Report for This Property
The Home Valuation Report is an in-depth analysis detailing your home's value as well as a comparison with similar homes in the area
Home Values in the Area
Average Home Value in this Area
Purchase History
| Date | Buyer | Sale Price | Title Company |
|---|---|---|---|
| Zhou Dandan | $504,888 | None Available | |
| Gallagher Lauren | $426,000 | None Available | |
| Smith Serena H | $385,000 | None Available | |
| Qs Private Lending Llc | $950,000 | None Available | |
| 225 Main Street Llc | $544,900 | -- | |
| North Anne M | $90,000 | -- | |
| North Anne M | $90,000 | -- |
Source: Public Records
Mortgage History
| Date | Status | Borrower | Loan Amount |
|---|---|---|---|
| Open | Zhou Dandan | $302,933 | |
| Previous Owner | Gallagher Lauren | $356,000 | |
| Previous Owner | Smith Serena H | $308,000 | |
| Previous Owner | 225 Main Street Llc | $790,000 | |
| Previous Owner | North Anne M | $35,000 | |
| Previous Owner | North Anne M | $85,000 |
Source: Public Records
Property History
| Date | Event | Price | List to Sale | Price per Sq Ft |
|---|---|---|---|---|
| 10/08/2024 10/08/24 | Off Market | $2,600 | -- | -- |
| 07/01/2024 07/01/24 | For Rent | $2,600 | -- | -- |
Tax History
| Year | Tax Paid | Tax Assessment Tax Assessment Total Assessment is a certain percentage of the fair market value that is determined by local assessors to be the total taxable value of land and additions on the property. | Land | Improvement |
|---|---|---|---|---|
| 2025 | $0 | $0 | $0 | $0 |
| 2024 | $0 | $0 | $0 | $0 |
| 2023 | $4,448 | $0 | $0 | $0 |
| 2022 | $4,448 | $0 | $0 | $0 |
| 2021 | $4,448 | $450,700 | $167,800 | $282,900 |
| 2020 | $4,374 | $411,100 | $167,800 | $243,300 |
| 2019 | $6,070 | $490,300 | $159,800 | $330,500 |
| 2018 | $4,775 | $346,500 | $139,300 | $207,200 |
| 2017 | $4,598 | $318,400 | $116,100 | $202,300 |
| 2016 | $3,936 | $272,400 | $107,100 | $165,300 |
| 2015 | $3,726 | $255,000 | $100,700 | $154,300 |
Source: Public Records
Map
Nearby Homes
- 68 Linden St Unit 49
- 39 Parlin St Unit 203
- 340 Main St
- 24 Corey St Unit 101
- 9 Carter St
- 48 Cleveland Ave
- 139 Bucknam St
- 39 Montrose St Unit 2
- 19 Heath St
- 30 Chelsea St Unit 210
- 34 Paris St
- 15 Staples Ave Unit 45
- 15 Staples Ave Unit 31
- 21 Staples Ave Unit 26
- 44-46 Cabot St
- 43 Charlton St Unit B108
- 21 Central Ave Unit 10
- 37 Argyle St
- 44 Walnut St
- 120 Wyllis Ave Unit 217
Your Personal Tour Guide
Ask me questions while you tour the home.