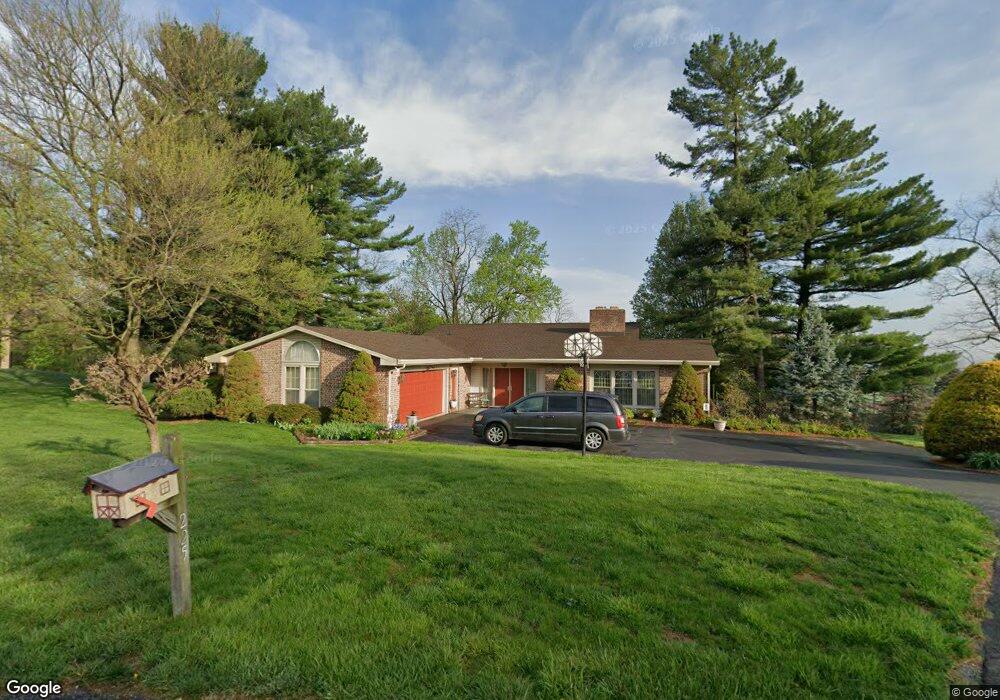
225 Maple Dr New Holland, PA 17557
Estimated Value: $519,130 - $586,000
4
Beds
3
Baths
1,802
Sq Ft
$308/Sq Ft
Est. Value
About This Home
This home is located at 225 Maple Dr, New Holland, PA 17557 and is currently estimated at $554,533, approximately $307 per square foot. 225 Maple Dr is a home located in Lancaster County with nearby schools including Garden Spot Middle School, Garden Spot Senior High School, and Mill Creek Valley Parochial School.
Ownership History
Date
Name
Owned For
Owner Type
Purchase Details
Closed on
Oct 29, 2002
Sold by
Nisly Jason and Nisly Linda S
Bought by
Hellings Edwin W and Hellings Carol E
Current Estimated Value
Home Financials for this Owner
Home Financials are based on the most recent Mortgage that was taken out on this home.
Original Mortgage
$160,000
Outstanding Balance
$67,362
Interest Rate
6.09%
Estimated Equity
$487,171
Purchase Details
Closed on
May 28, 1999
Sold by
Dell John F and Dell Emma M
Bought by
Nisly Jason and Nisly Linda S
Home Financials for this Owner
Home Financials are based on the most recent Mortgage that was taken out on this home.
Original Mortgage
$90,000
Interest Rate
6.85%
Create a Home Valuation Report for This Property
The Home Valuation Report is an in-depth analysis detailing your home's value as well as a comparison with similar homes in the area
Home Values in the Area
Average Home Value in this Area
Purchase History
| Date | Buyer | Sale Price | Title Company |
|---|---|---|---|
| Hellings Edwin W | $228,000 | First American Title Ins Co | |
| Nisly Jason | $200,000 | -- |
Source: Public Records
Mortgage History
| Date | Status | Borrower | Loan Amount |
|---|---|---|---|
| Open | Hellings Edwin W | $160,000 | |
| Previous Owner | Nisly Jason | $90,000 |
Source: Public Records
Tax History Compared to Growth
Tax History
| Year | Tax Paid | Tax Assessment Tax Assessment Total Assessment is a certain percentage of the fair market value that is determined by local assessors to be the total taxable value of land and additions on the property. | Land | Improvement |
|---|---|---|---|---|
| 2025 | $5,254 | $305,700 | $90,300 | $215,400 |
| 2024 | $5,254 | $305,700 | $90,300 | $215,400 |
| 2023 | $5,175 | $305,700 | $90,300 | $215,400 |
| 2022 | $5,117 | $305,700 | $90,300 | $215,400 |
| 2021 | $5,032 | $305,700 | $90,300 | $215,400 |
| 2020 | $5,032 | $305,700 | $90,300 | $215,400 |
| 2019 | $4,975 | $305,700 | $90,300 | $215,400 |
| 2018 | $7,444 | $305,700 | $90,300 | $215,400 |
| 2017 | $3,959 | $197,700 | $49,800 | $147,900 |
| 2016 | $3,959 | $197,700 | $49,800 | $147,900 |
| 2015 | $986 | $197,700 | $49,800 | $147,900 |
| 2014 | $2,785 | $197,700 | $49,800 | $147,900 |
Source: Public Records
Map
Nearby Homes
- 770 (rear lot) Maple Grove Rd
- 259 Hill Rd
- 206 N New Holland Rd
- 406 Brimmer Ave
- 227 Locust St
- 80 Diller Ave Unit 9
- 385 Valley View Dr
- 13 Amber Cir
- 391 E Jackson St
- 148 E Broad St
- 144 W Conestoga St
- 20 N Kinzer Ave
- 41 Ashlea Village
- 220 Sycamore Ln
- 753 Walnut St
- 529 Ranck Rd Unit 1
- 529 Ranck Rd Unit 2
- 529 Ranck Rd Unit 3
- 529 Ranck Rd Unit 4
- 529 Ranck Rd Unit 5