Estimated Value: $200,000 - $251,000
--
Bed
1
Bath
1,777
Sq Ft
$127/Sq Ft
Est. Value
About This Home
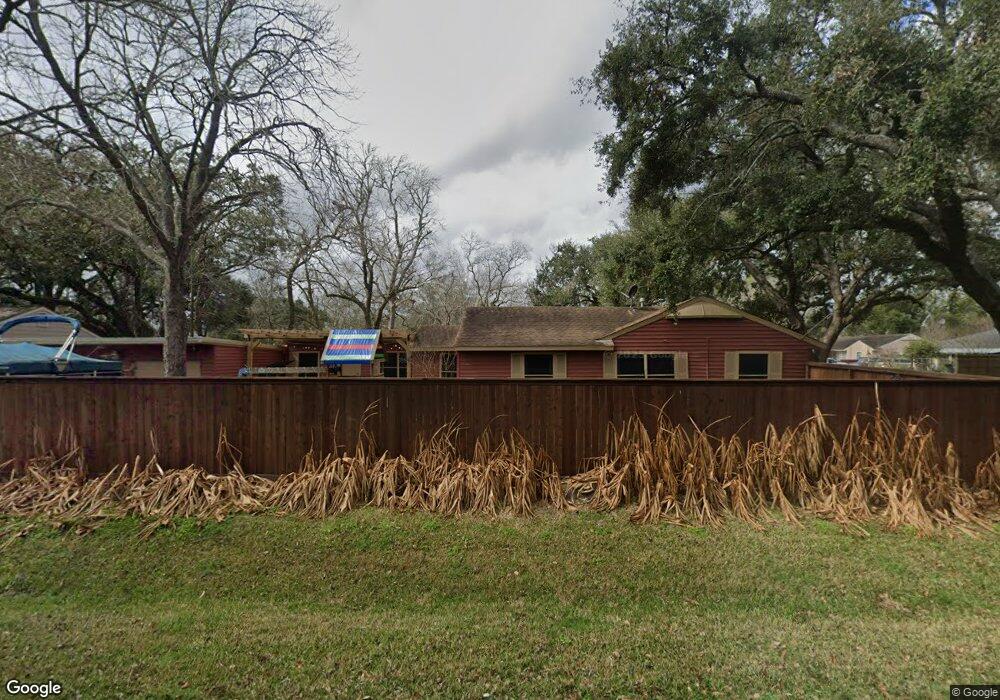
This home is located at 225 Mclemore Dr, Alvin, TX 77511 and is currently estimated at $226,496, approximately $127 per square foot. 225 Mclemore Dr is a home located in Brazoria County with nearby schools including Fairview Junior High School and Alvin High School.
Ownership History
Date
Name
Owned For
Owner Type
Purchase Details
Closed on
Dec 9, 2015
Sold by
Brady Willis E and Brady Geraldine
Bought by
Clerk Simmons Cheryl
Current Estimated Value
Purchase Details
Closed on
May 24, 2002
Sold by
Schulz William Jay and Schulz Michelle
Bought by
Clark Cheryl L and Brady Willis E
Home Financials for this Owner
Home Financials are based on the most recent Mortgage that was taken out on this home.
Original Mortgage
$78,155
Interest Rate
6.92%
Mortgage Type
FHA
Purchase Details
Closed on
Nov 17, 2000
Sold by
Schulz Gloria Ann
Bought by
Schulz William Jay and Schulz Michelle
Home Financials for this Owner
Home Financials are based on the most recent Mortgage that was taken out on this home.
Original Mortgage
$59,535
Interest Rate
7.82%
Mortgage Type
FHA
Create a Home Valuation Report for This Property
The Home Valuation Report is an in-depth analysis detailing your home's value as well as a comparison with similar homes in the area
Home Values in the Area
Average Home Value in this Area
Purchase History
| Date | Buyer | Sale Price | Title Company |
|---|---|---|---|
| Clerk Simmons Cheryl | -- | None Available | |
| Clark Cheryl L | -- | Chicago Title | |
| Schulz William Jay | -- | Commerce Land Title Inc |
Source: Public Records
Mortgage History
| Date | Status | Borrower | Loan Amount |
|---|---|---|---|
| Previous Owner | Clark Cheryl L | $78,155 | |
| Previous Owner | Schulz William Jay | $59,535 |
Source: Public Records
Tax History Compared to Growth
Tax History
| Year | Tax Paid | Tax Assessment Tax Assessment Total Assessment is a certain percentage of the fair market value that is determined by local assessors to be the total taxable value of land and additions on the property. | Land | Improvement |
|---|---|---|---|---|
| 2025 | $3,696 | $231,920 | $38,160 | $193,760 |
| 2023 | $3,696 | $197,811 | $31,170 | $198,520 |
| 2022 | $4,933 | $179,828 | $31,170 | $170,000 |
| 2021 | $4,720 | $163,480 | $23,370 | $140,110 |
| 2020 | $4,482 | $157,080 | $20,040 | $137,040 |
| 2019 | $4,181 | $150,930 | $16,700 | $134,230 |
| 2018 | $3,808 | $126,550 | $16,700 | $109,850 |
| 2017 | $3,554 | $116,640 | $16,700 | $99,940 |
| 2016 | $3,554 | $116,640 | $16,700 | $99,940 |
| 2015 | $2,729 | $92,640 | $13,910 | $78,730 |
| 2014 | $2,729 | $87,790 | $13,910 | $73,880 |
Source: Public Records
Map
Nearby Homes
- 237 Mclemore Dr
- 709 E Highway 6
- 417 E Park Dr
- 2466 Highway 6
- 0 W Sealy St
- 716 Gubert Ln
- 650 E Adoue St
- 699 Rachel St
- 694 St Croix St
- 0 Dilling St
- 899 Medic Ln
- 412 W Sidnor St
- 695 Elizabeth St
- 1300 Dickinson Rd
- 417 W Blum St
- 403 S Hill St Unit L
- 303 S Jackson St
- 313 E Dumble St
- 711 W Sidnor St
- 903 Dula St
- 221 Mclemore Dr
- 231 Mclemore Dr
- 217 Mclemore Dr
- 233 Mclemore Dr
- 230 Mclemore Dr
- 228 Mclemore Dr
- 232 Mclemore Dr
- 207 Mclemore Dr
- 213 Mclemore Dr
- 222 Mclemore Dr
- 224 Mclemore Dr
- 220 Mclemore Dr
- 235 Mclemore Dr
- 234 Mclemore Dr
- 226 Mclemore Dr
- 205 Mclemore Dr
- 218 Mclemore Dr
- 236 Mclemore Dr
- 203 Mclemore Dr
- 216 Mclemore Dr