Estimated Value: $469,977 - $602,000
6
Beds
3
Baths
2,538
Sq Ft
$203/Sq Ft
Est. Value
About This Home
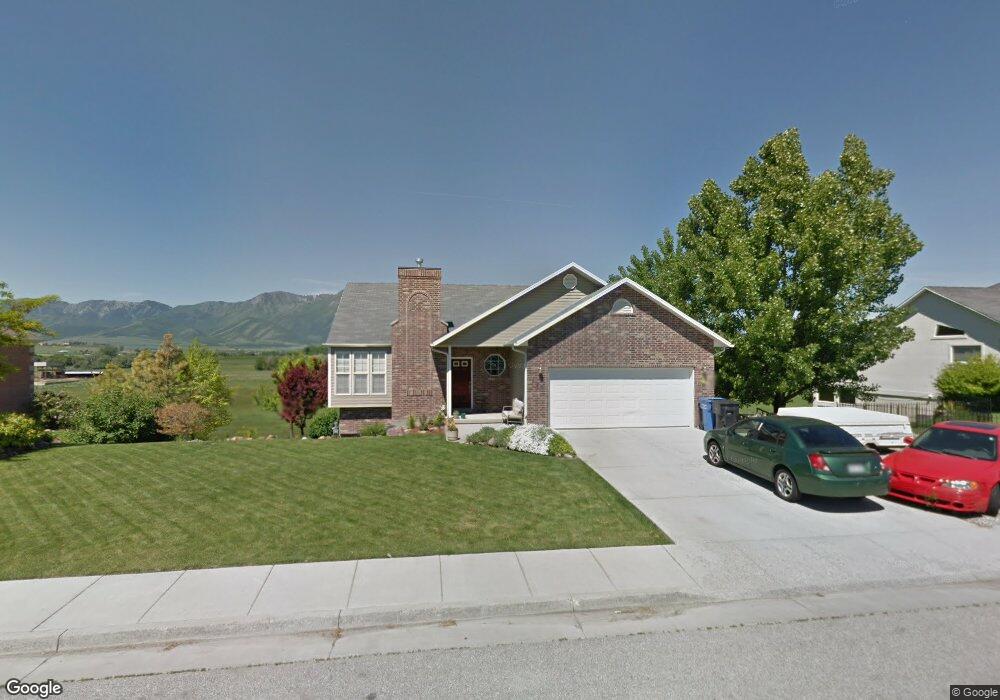
This home is located at 225 N 850 W, Hyrum, UT 84319 and is currently estimated at $514,994, approximately $202 per square foot. 225 N 850 W is a home located in Cache County with nearby schools including Lincoln School, South Cache Middle School, and Mountain Crest High School.
Ownership History
Date
Name
Owned For
Owner Type
Purchase Details
Closed on
Oct 17, 2018
Sold by
Bodily Bryan D
Bought by
Souter Blake R and Souter Crystalyn Mobo
Current Estimated Value
Home Financials for this Owner
Home Financials are based on the most recent Mortgage that was taken out on this home.
Original Mortgage
$283,333
Outstanding Balance
$246,574
Interest Rate
4.5%
Mortgage Type
New Conventional
Estimated Equity
$268,420
Purchase Details
Closed on
Feb 8, 2012
Sold by
Bodily Bryan
Bought by
Bodily Bryan D
Purchase Details
Closed on
Sep 12, 2002
Sold by
Parker Blake H
Bought by
Webb R Curt
Home Financials for this Owner
Home Financials are based on the most recent Mortgage that was taken out on this home.
Original Mortgage
$120,000
Interest Rate
6.24%
Create a Home Valuation Report for This Property
The Home Valuation Report is an in-depth analysis detailing your home's value as well as a comparison with similar homes in the area
Home Values in the Area
Average Home Value in this Area
Purchase History
| Date | Buyer | Sale Price | Title Company |
|---|---|---|---|
| Souter Blake R | -- | Pinnacle Title | |
| Bodily Bryan D | -- | Cache Title Company | |
| Bodily Bryan D | -- | Cache Title Company | |
| Webb R Curt | -- | Cache Title Company |
Source: Public Records
Mortgage History
| Date | Status | Borrower | Loan Amount |
|---|---|---|---|
| Open | Souter Blake R | $283,333 | |
| Previous Owner | Webb R Curt | $120,000 |
Source: Public Records
Tax History Compared to Growth
Tax History
| Year | Tax Paid | Tax Assessment Tax Assessment Total Assessment is a certain percentage of the fair market value that is determined by local assessors to be the total taxable value of land and additions on the property. | Land | Improvement |
|---|---|---|---|---|
| 2025 | $178 | $255,980 | $0 | $0 |
| 2024 | $1,734 | $232,445 | $0 | $0 |
| 2023 | $1,817 | $232,895 | $0 | $0 |
| 2022 | $1,896 | $232,895 | $0 | $0 |
| 2021 | $1,858 | $351,755 | $65,000 | $286,755 |
| 2020 | $1,757 | $312,000 | $65,000 | $247,000 |
| 2019 | $1,718 | $287,000 | $40,000 | $247,000 |
| 2018 | $1,264 | $204,230 | $40,000 | $164,230 |
| 2017 | $1,242 | $104,115 | $0 | $0 |
| 2016 | $1,270 | $104,115 | $0 | $0 |
| 2015 | $1,190 | $97,290 | $0 | $0 |
| 2014 | $1,197 | $100,040 | $0 | $0 |
| 2013 | -- | $100,040 | $0 | $0 |
Source: Public Records
Map
Nearby Homes
- 225 N 850 W Unit 45
- 225 N 850 W Unit 22
- 235 N 850 W
- 195 N 850 W Unit 21
- 195 N 850 W
- 210 N 850 W Unit 40
- 210 N 850 W
- 230 N 850 W
- 185 N 850 W Unit 20
- 185 N 850 W
- 190 N 850 W Unit 39
- 190 N 850 W
- 245 N 850 W Unit 24
- 242 N 850 W
- 170 N 850 W
- 170 N 850 W Unit 38
- 860 W 250 N Unit 25
- 827 W 250 N
- 195 N 800 W Unit 46
- 195 N 800 W