225 N Cecil St Philadelphia, PA 19139
Haddington NeighborhoodEstimated Value: $83,000 - $169,575
4
Beds
1
Bath
1,020
Sq Ft
$121/Sq Ft
Est. Value
About This Home
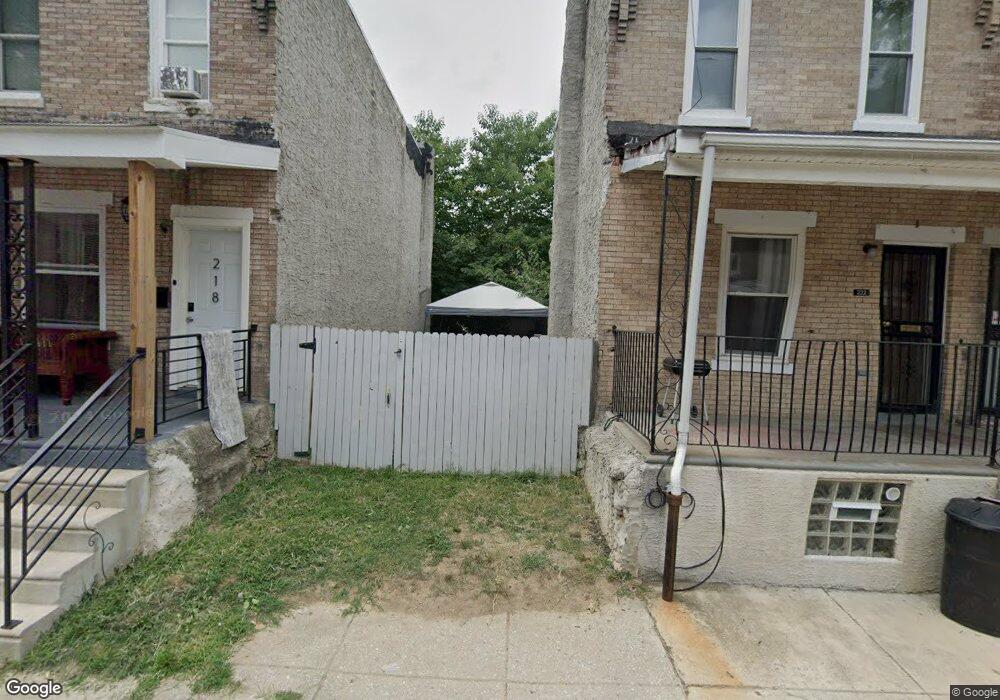
This home is located at 225 N Cecil St, Philadelphia, PA 19139 and is currently estimated at $123,894, approximately $121 per square foot. 225 N Cecil St is a home located in Philadelphia County with nearby schools including John Barry Elementary School, William L. Sayre High School, and Universal Bluford Charter School.
Ownership History
Date
Name
Owned For
Owner Type
Purchase Details
Closed on
Mar 6, 2009
Sold by
Philadelphia Housing Authority
Bought by
Moore Castoria
Current Estimated Value
Home Financials for this Owner
Home Financials are based on the most recent Mortgage that was taken out on this home.
Original Mortgage
$40,120
Outstanding Balance
$25,578
Interest Rate
5.18%
Mortgage Type
Unknown
Estimated Equity
$98,316
Create a Home Valuation Report for This Property
The Home Valuation Report is an in-depth analysis detailing your home's value as well as a comparison with similar homes in the area
Home Values in the Area
Average Home Value in this Area
Purchase History
| Date | Buyer | Sale Price | Title Company |
|---|---|---|---|
| Moore Castoria | $43,000 | None Available |
Source: Public Records
Mortgage History
| Date | Status | Borrower | Loan Amount |
|---|---|---|---|
| Open | Moore Castoria | $40,120 |
Source: Public Records
Tax History Compared to Growth
Tax History
| Year | Tax Paid | Tax Assessment Tax Assessment Total Assessment is a certain percentage of the fair market value that is determined by local assessors to be the total taxable value of land and additions on the property. | Land | Improvement |
|---|---|---|---|---|
| 2025 | $857 | $92,300 | $18,460 | $73,840 |
| 2024 | $857 | $92,300 | $18,460 | $73,840 |
| 2023 | $857 | $61,200 | $12,200 | $49,000 |
| 2022 | $227 | $16,200 | $12,200 | $4,000 |
| 2021 | $740 | $0 | $0 | $0 |
| 2020 | $740 | $0 | $0 | $0 |
| 2019 | $714 | $0 | $0 | $0 |
| 2018 | $440 | $0 | $0 | $0 |
| 2017 | $440 | $0 | $0 | $0 |
| 2016 | $20 | $0 | $0 | $0 |
| 2015 | $3,068 | $0 | $0 | $0 |
| 2014 | -- | $31,400 | $3,572 | $27,828 |
| 2012 | -- | $4,544 | $351 | $4,193 |
Source: Public Records
Map
Nearby Homes