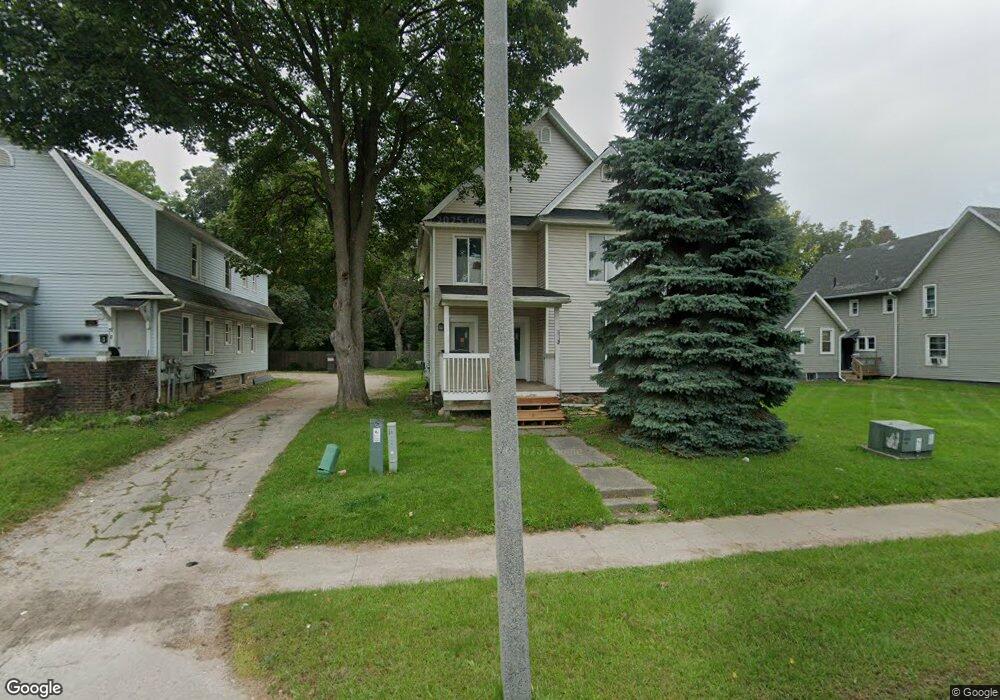
225 N Mlk jr Blvd Lansing, MI 48915
Westside NeighborhoodEstimated Value: $137,000 - $197,000
4
Beds
4
Baths
1,922
Sq Ft
$83/Sq Ft
Est. Value
About This Home
This home is located at 225 N Mlk jr Blvd, Lansing, MI 48915 and is currently estimated at $160,071, approximately $83 per square foot. 225 N Mlk jr Blvd is a home located in Ingham County with nearby schools including Riddle Elementary School, Pattengill Academy, and J.W. Sexton High School.
Ownership History
Date
Name
Owned For
Owner Type
Purchase Details
Closed on
Nov 22, 2022
Sold by
Burk Marvin
Bought by
Burk Marvin
Current Estimated Value
Purchase Details
Closed on
Apr 1, 2014
Sold by
Thorpe Todd
Bought by
Burk Marvin
Purchase Details
Closed on
Aug 24, 2007
Sold by
Mortgage Electronic Registration Systems
Bought by
Bank Of New York and The Certificateholders Cwalt Inc Alterna
Purchase Details
Closed on
Aug 2, 2007
Sold by
Tibaldi Joseph L and Tibaldi Patricia M
Bought by
Mortgage Electronic Registration Systems
Purchase Details
Closed on
Mar 16, 2001
Sold by
Moore Lawrence W
Bought by
Keytons Development Corp
Create a Home Valuation Report for This Property
The Home Valuation Report is an in-depth analysis detailing your home's value as well as a comparison with similar homes in the area
Home Values in the Area
Average Home Value in this Area
Purchase History
| Date | Buyer | Sale Price | Title Company |
|---|---|---|---|
| Burk Marvin | -- | Land Title | |
| Burk Marvin | -- | None Available | |
| Bank Of New York | -- | None Available | |
| Mortgage Electronic Registration Systems | $69,705 | None Available | |
| Keytons Development Corp | $55,000 | -- |
Source: Public Records
Tax History Compared to Growth
Tax History
| Year | Tax Paid | Tax Assessment Tax Assessment Total Assessment is a certain percentage of the fair market value that is determined by local assessors to be the total taxable value of land and additions on the property. | Land | Improvement |
|---|---|---|---|---|
| 2025 | $3,809 | $67,600 | $6,200 | $61,400 |
| 2024 | $29 | $56,500 | $6,200 | $50,300 |
| 2023 | $3,346 | $51,000 | $6,200 | $44,800 |
| 2022 | $3,061 | $45,800 | $6,400 | $39,400 |
| 2021 | $3,224 | $41,000 | $7,700 | $33,300 |
| 2020 | $3,592 | $38,100 | $7,700 | $30,400 |
| 2019 | $3,179 | $37,800 | $7,700 | $30,100 |
| 2018 | $2,885 | $34,500 | $7,700 | $26,800 |
| 2017 | $2,713 | $34,500 | $7,700 | $26,800 |
| 2016 | $4,726 | $34,000 | $7,700 | $26,300 |
| 2015 | $4,726 | $32,800 | $15,439 | $17,361 |
| 2014 | $4,726 | $31,700 | $13,750 | $17,950 |
Source: Public Records
Map
Nearby Homes
- 1128 W Michigan Ave
- 1232 W Michigan Ave
- 416 N Martin Luther King Junior Blvd
- 418 N Martin Luther King Junior Blvd
- 422 N Martin Luther King Junior Blvd
- 312 N Butler Blvd
- 1314 W Ottawa St
- 1017 W Genesee St
- 1234 W Allegan St
- 427 N Butler Blvd
- 425/425.5 N Butler Blvd
- 1319 W Michigan Ave
- 433 N Butler Blvd
- 1313 S Genesee Dr
- 1128 W Washtenaw St
- 325 N Sycamore St
- 531 N Butler Blvd
- 201 S Jenison Ave
- 425 N Jenison Ave
- 1528 W Shiawassee St
- 225 N Mlk Blvd Unit 1
- 219 N Martin Luther King jr Blvd
- 219 N Mlk Blvd
- 233 N Mlk
- 233 N Mlk
- 233 N Martin Luther King jr Blvd
- 215 N Mlk Blvd
- 215 N Martin Luther King jr Blvd
- 1117 W Ionia St
- 1119 W Ionia St
- 1100 W Ottawa St
- 1121 W Ionia St
- 1108 W Ottaa
- 1108 W Ottawa St
- 1114 W Ottawa St
- 1112 W Ottawa St
- 1122 W Ottawa St
- 1129 W Ionia St
- 1108 W Ionia St
- 1015 W Ionia St