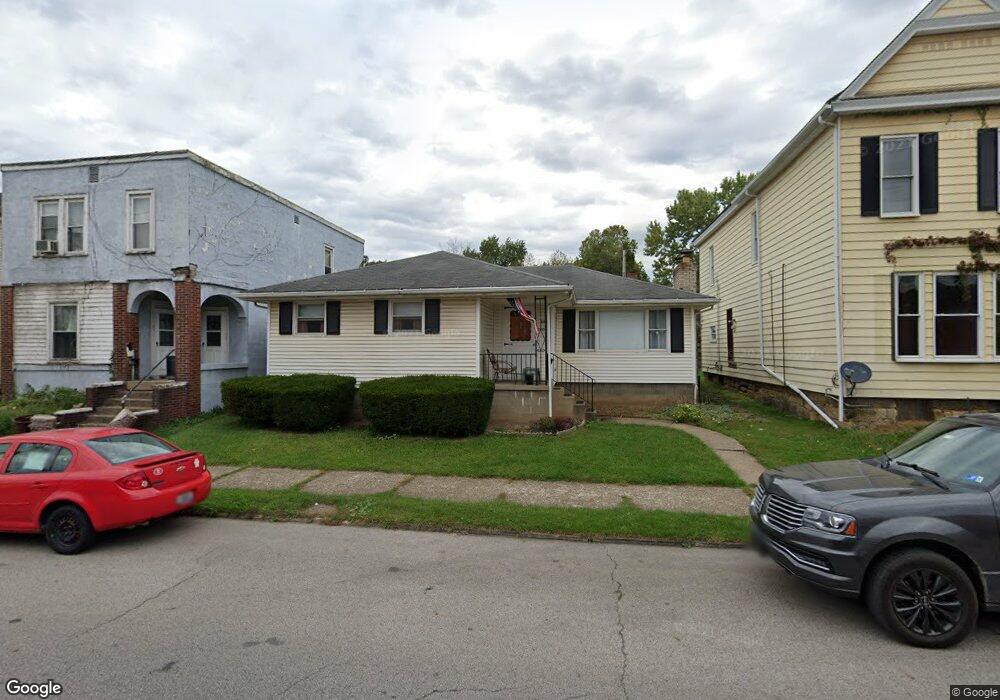
225 N Zane Hwy Martins Ferry, OH 43935
Estimated Value: $114,000 - $147,000
3
Beds
2
Baths
1,310
Sq Ft
$102/Sq Ft
Est. Value
About This Home
This home is located at 225 N Zane Hwy, Martins Ferry, OH 43935 and is currently estimated at $133,825, approximately $102 per square foot. 225 N Zane Hwy is a home located in Belmont County with nearby schools including Anna Marie Ayers Elementary School, Martins Ferry Middle School, and Martins Ferry High School.
Ownership History
Date
Name
Owned For
Owner Type
Purchase Details
Closed on
Oct 20, 2010
Sold by
Keenan Nova Jean and Hegedus Antoinette
Bought by
Manion Terri L
Current Estimated Value
Home Financials for this Owner
Home Financials are based on the most recent Mortgage that was taken out on this home.
Original Mortgage
$62,577
Outstanding Balance
$41,336
Interest Rate
4.37%
Mortgage Type
FHA
Estimated Equity
$92,489
Purchase Details
Closed on
Dec 16, 2005
Sold by
Irwin Edwin I
Bought by
Hegedus Antoinette
Purchase Details
Closed on
Jan 21, 1994
Sold by
Irwin Edwin I and Irwin Nova J
Bought by
Irwin Edwin I and Irwin Nova J
Purchase Details
Closed on
Jan 1, 1986
Sold by
Irwin Eleanor
Bought by
Irwin Eleanor
Create a Home Valuation Report for This Property
The Home Valuation Report is an in-depth analysis detailing your home's value as well as a comparison with similar homes in the area
Home Values in the Area
Average Home Value in this Area
Purchase History
| Date | Buyer | Sale Price | Title Company |
|---|---|---|---|
| Manion Terri L | $63,500 | Attorney | |
| Hegedus Antoinette | -- | None Available | |
| Irwin Edwin I | -- | -- | |
| Irwin Eleanor | -- | -- |
Source: Public Records
Mortgage History
| Date | Status | Borrower | Loan Amount |
|---|---|---|---|
| Open | Manion Terri L | $62,577 |
Source: Public Records
Tax History Compared to Growth
Tax History
| Year | Tax Paid | Tax Assessment Tax Assessment Total Assessment is a certain percentage of the fair market value that is determined by local assessors to be the total taxable value of land and additions on the property. | Land | Improvement |
|---|---|---|---|---|
| 2024 | $1,546 | $37,670 | $3,230 | $34,440 |
| 2023 | $1,402 | $31,330 | $2,470 | $28,860 |
| 2022 | $1,402 | $31,331 | $2,474 | $28,857 |
| 2021 | $1,395 | $31,331 | $2,474 | $28,857 |
| 2020 | $1,308 | $27,250 | $2,150 | $25,100 |
| 2019 | $1,310 | $27,250 | $2,150 | $25,100 |
| 2018 | $1,178 | $27,250 | $2,150 | $25,100 |
| 2017 | $1,109 | $23,400 | $3,680 | $19,720 |
| 2016 | $1,113 | $23,400 | $3,680 | $19,720 |
| 2015 | $1,004 | $23,400 | $3,680 | $19,720 |
| 2014 | $957 | $22,130 | $3,350 | $18,780 |
| 2013 | $909 | $22,130 | $3,350 | $18,780 |
Source: Public Records
Map
Nearby Homes