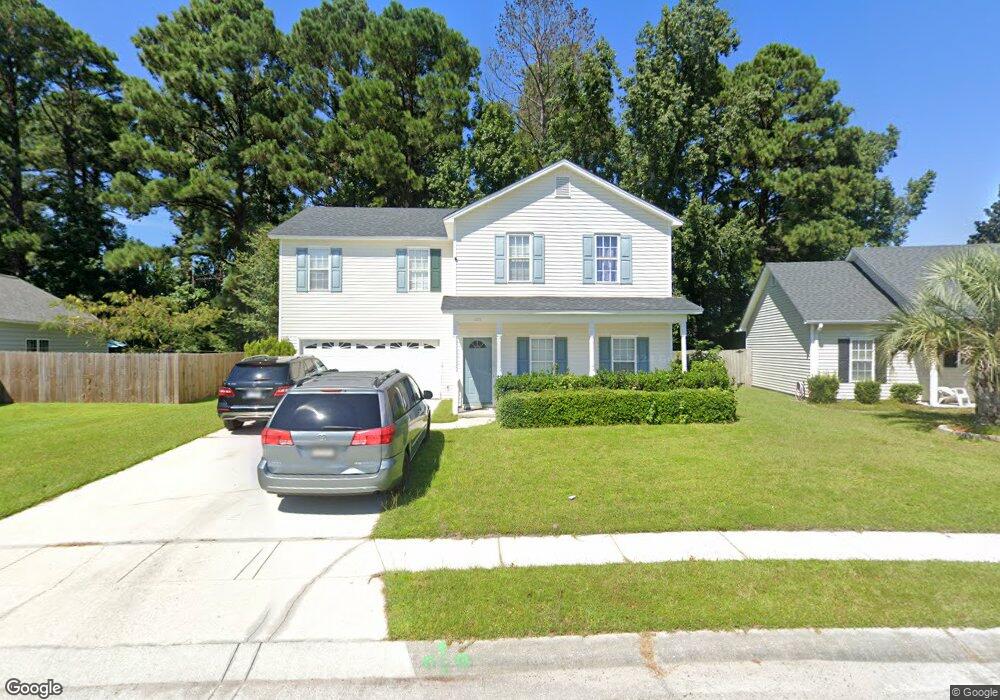
225 Olde Well Loop Rd Wilmington, NC 28411
Estimated Value: $368,000 - $409,000
3
Beds
2
Baths
2,016
Sq Ft
$191/Sq Ft
Est. Value
About This Home
This home is located at 225 Olde Well Loop Rd, Wilmington, NC 28411 and is currently estimated at $385,748, approximately $191 per square foot. 225 Olde Well Loop Rd is a home located in New Hanover County with nearby schools including John J. Blair Elementary School, Emma B. Trask Middle School, and Emsley A. Laney High School.
Ownership History
Date
Name
Owned For
Owner Type
Purchase Details
Closed on
Feb 13, 2017
Sold by
Chen Hui and Ni Zhen
Bought by
Ni Min and Yu Jai
Current Estimated Value
Home Financials for this Owner
Home Financials are based on the most recent Mortgage that was taken out on this home.
Original Mortgage
$165,350
Outstanding Balance
$136,903
Interest Rate
4.2%
Mortgage Type
New Conventional
Estimated Equity
$248,845
Purchase Details
Closed on
Sep 4, 2003
Sold by
Ni Zhen
Bought by
Ni Zhen Hui Chen
Purchase Details
Closed on
Aug 23, 2001
Sold by
Sunrise Homes Inc
Bought by
Ni Zhen
Purchase Details
Closed on
Mar 29, 1999
Sold by
Landmark Homes Inc
Bought by
Sunrise Homes Inc
Purchase Details
Closed on
Jun 24, 1998
Sold by
Farrington Farms Develop Corp
Bought by
Landmark Homes Inc
Purchase Details
Closed on
Nov 14, 1995
Sold by
Gts Development Llc
Bought by
Farrington Farms Develop Corp
Create a Home Valuation Report for This Property
The Home Valuation Report is an in-depth analysis detailing your home's value as well as a comparison with similar homes in the area
Home Values in the Area
Average Home Value in this Area
Purchase History
| Date | Buyer | Sale Price | Title Company |
|---|---|---|---|
| Ni Min | $188,000 | Tiago Title Llc | |
| Ni Zhen Hui Chen | -- | -- | |
| Ni Zhen | $150,000 | -- | |
| Sunrise Homes Inc | $3,974,500 | -- | |
| Landmark Homes Inc | $414,000 | -- | |
| Farrington Farms Develop Corp | -- | -- |
Source: Public Records
Mortgage History
| Date | Status | Borrower | Loan Amount |
|---|---|---|---|
| Open | Ni Min | $165,350 |
Source: Public Records
Tax History
| Year | Tax Paid | Tax Assessment Tax Assessment Total Assessment is a certain percentage of the fair market value that is determined by local assessors to be the total taxable value of land and additions on the property. | Land | Improvement |
|---|---|---|---|---|
| 2025 | $1,412 | $353,700 | $102,000 | $251,700 |
| 2023 | $1,453 | $265,200 | $55,800 | $209,400 |
| 2022 | $1,467 | $265,200 | $55,800 | $209,400 |
| 2021 | $1,464 | $265,200 | $55,800 | $209,400 |
| 2020 | $1,256 | $198,600 | $44,000 | $154,600 |
| 2019 | $1,256 | $198,600 | $44,000 | $154,600 |
| 2018 | $1,256 | $198,600 | $44,000 | $154,600 |
| 2017 | $1,286 | $198,600 | $44,000 | $154,600 |
| 2016 | $1,254 | $181,000 | $42,000 | $139,000 |
| 2015 | $1,166 | $181,000 | $42,000 | $139,000 |
| 2014 | $1,146 | $181,000 | $42,000 | $139,000 |
Source: Public Records
Map
Nearby Homes
- 6611 Wheatfields Ct
- 207 Olde Well Loop Rd
- 7300 Farrington Farms Dr
- 5332 Sun Coast Dr
- 6331 Gordon Rd
- 1915 Daniel Boone Trail
- 6329 Gordon Rd
- 5256 Sun Coast Dr
- 2513 Sapling Cir
- 2032 White Rd
- 2107 White Rd
- 2720 Tarbert Ct
- 7101 Medallion Place
- 6110 Gordon Rd
- 2401 Sapling Cir
- 519 Montego Ct
- 814 Bay Blossom Dr
- 7217 Haskell Ct
- 807 Spy Glass Ct
- 2200 Inkberry Ct
- 227 Olde Well Loop Rd
- 229 Olde Well Loop Rd
- 221 Olde Well Loop Rd
- 7119 Farrington Farms Dr
- 216 Olde Well Loop Rd
- 6612 Wheatfields Ct
- 6614 Wheatfields Ct
- 6610 Wheatfields Ct
- 214 Olde Well Loop Rd
- 7117 Farrington Farms Dr
- 6616 Wheatfields Ct
- 6608 Wheatfields Ct
- 217 Olde Well Loop Rd
- 6618 Wheatfields Ct
- 6606 Wheatfields Ct
- 212 Olde Well Loop Rd
- 7115 Farrington Farms Dr
- 7202 Farrington Farms Dr
- 7200 Farrington Farms Dr
- 7120 Farrington Farms Dr
Your Personal Tour Guide
Ask me questions while you tour the home.