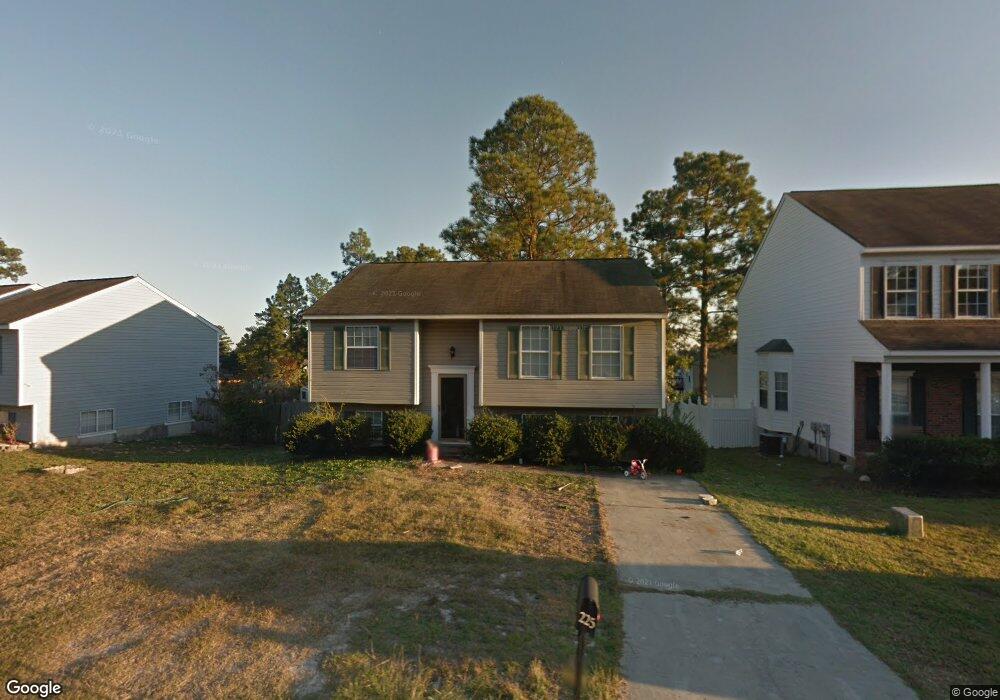
225 Orchard Hill Dr West Columbia, SC 29170
Estimated Value: $173,000 - $247,000
4
Beds
3
Baths
1,618
Sq Ft
$128/Sq Ft
Est. Value
About This Home
This home is located at 225 Orchard Hill Dr, West Columbia, SC 29170 and is currently estimated at $207,292, approximately $128 per square foot. 225 Orchard Hill Dr is a home located in Lexington County with nearby schools including White Knoll Elementary School, White Knoll Middle School, and White Knoll High School.
Ownership History
Date
Name
Owned For
Owner Type
Purchase Details
Closed on
Jan 22, 2019
Sold by
Conrex Master Llc
Bought by
Conrex Residential Sma I 2018 01 Operati
Current Estimated Value
Home Financials for this Owner
Home Financials are based on the most recent Mortgage that was taken out on this home.
Original Mortgage
$50,000,000
Interest Rate
4.6%
Mortgage Type
Commercial
Purchase Details
Closed on
Sep 4, 2018
Sold by
Secretary Of Hud
Bought by
Conrex Master Llc
Purchase Details
Closed on
Dec 1, 2017
Sold by
Hsbc Bank Usa
Bought by
Secretary Of Hud
Purchase Details
Closed on
Oct 13, 2017
Sold by
Covington Areen
Bought by
Hsbc Bank Usa and Mastr Reperforming Loan Trust
Purchase Details
Closed on
Sep 28, 2001
Sold by
Marc Homebuilders Inc
Bought by
Covington Areen
Create a Home Valuation Report for This Property
The Home Valuation Report is an in-depth analysis detailing your home's value as well as a comparison with similar homes in the area
Home Values in the Area
Average Home Value in this Area
Purchase History
| Date | Buyer | Sale Price | Title Company |
|---|---|---|---|
| Conrex Residential Sma I 2018 01 Operati | $500,684 | None Available | |
| Conrex Master Llc | $94,000 | None Available | |
| Secretary Of Hud | -- | None Available | |
| Hsbc Bank Usa | $70,000 | None Available | |
| Covington Areen | $93,470 | -- |
Source: Public Records
Mortgage History
| Date | Status | Borrower | Loan Amount |
|---|---|---|---|
| Closed | Conrex Residential Sma I 2018 01 Operati | $50,000,000 |
Source: Public Records
Tax History Compared to Growth
Tax History
| Year | Tax Paid | Tax Assessment Tax Assessment Total Assessment is a certain percentage of the fair market value that is determined by local assessors to be the total taxable value of land and additions on the property. | Land | Improvement |
|---|---|---|---|---|
| 2024 | $3,223 | $6,504 | $1,500 | $5,004 |
| 2023 | $3,223 | $6,504 | $1,500 | $5,004 |
| 2022 | $3,100 | $6,504 | $1,500 | $5,004 |
| 2020 | $3,117 | $6,504 | $1,500 | $5,004 |
| 2019 | $3,124 | $6,298 | $1,320 | $4,978 |
| 2018 | $3,102 | $6,298 | $1,320 | $4,978 |
| 2017 | $622 | $4,199 | $880 | $3,319 |
| 2016 | $616 | $4,198 | $880 | $3,318 |
| 2014 | -- | $4,265 | $880 | $3,385 |
| 2013 | -- | $4,270 | $880 | $3,390 |
Source: Public Records
Map
Nearby Homes
- 136 Appletree Ln
- 164 Appletree Ln
- 179 Cherry Grove Dr
- 111 Sausage Ln
- 649 Laurel Rd
- 1027 Backman Rd
- 113 Berry Dr
- 180 Berry Dr
- 254 Megan Ln
- 189 Pebble Creek Dr
- 232 Lake Shire Dr
- 142 Katie Ct
- 117 Carlton Ct
- 230 Fox Lake Dr
- 104 Katie Ct
- 100 Elberta Dr
- 233 Fox Lake Dr
- 114 Pebble Brook Rd
- 225 Fox Lake Dr
- 110 Carlsbad Ct
- 229 Orchard Hill Dr
- 219 Orchard Hill Dr
- 105 Melon Dr
- 213 Orchard Hill Dr
- 109 Melon Dr
- 224 Orchard Hill Dr
- 209 Orchard Hill Dr
- 232 Orchard Hill Dr
- 239 Orchard Hill Dr
- 220 Orchard Hill Dr
- 113 Melon Dr
- 216 Orchard Hill Dr
- 108 Melon Dr
- 236 Orchard Hill Dr
- 205 Orchard Hill Dr
- 93 Cherry Grove Dr
- 243 Orchard Hill Dr
- 89 Cherry Grove Dr
- 100 Appletree Ln
- 117 Melon Dr