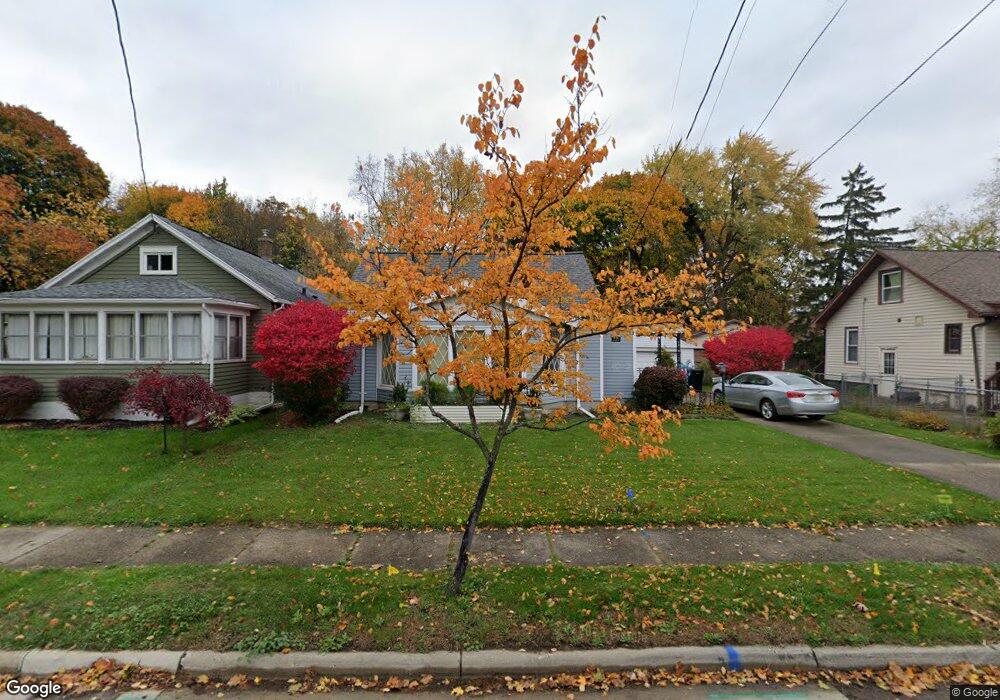
225 Riley St Lansing, MI 48910
Greencroft Park NeighborhoodEstimated Value: $128,726 - $141,000
Studio
1
Bath
972
Sq Ft
$138/Sq Ft
Est. Value
About This Home
This home is located at 225 Riley St, Lansing, MI 48910 and is currently estimated at $134,182, approximately $138 per square foot. 225 Riley St is a home located in Ingham County with nearby schools including Lyons Elementary School, Attwood School, and Everett High School.
Ownership History
Date
Name
Owned For
Owner Type
Purchase Details
Closed on
Jul 23, 1999
Sold by
Stanaway Rob A
Bought by
Posthumus Carol S
Current Estimated Value
Home Financials for this Owner
Home Financials are based on the most recent Mortgage that was taken out on this home.
Original Mortgage
$72,850
Outstanding Balance
$20,745
Interest Rate
7.77%
Mortgage Type
Purchase Money Mortgage
Estimated Equity
$113,437
Purchase Details
Closed on
Apr 1, 1995
Create a Home Valuation Report for This Property
The Home Valuation Report is an in-depth analysis detailing your home's value as well as a comparison with similar homes in the area
Home Values in the Area
Average Home Value in this Area
Purchase History
| Date | Buyer | Sale Price | Title Company |
|---|---|---|---|
| Posthumus Carol S | $72,900 | -- | |
| -- | $53,000 | -- |
Source: Public Records
Mortgage History
| Date | Status | Borrower | Loan Amount |
|---|---|---|---|
| Open | Posthumus Carol S | $72,850 |
Source: Public Records
Tax History
| Year | Tax Paid | Tax Assessment Tax Assessment Total Assessment is a certain percentage of the fair market value that is determined by local assessors to be the total taxable value of land and additions on the property. | Land | Improvement |
|---|---|---|---|---|
| 2025 | $2,476 | $61,400 | $10,500 | $50,900 |
| 2024 | $19 | $55,400 | $10,500 | $44,900 |
| 2023 | $2,323 | $50,800 | $10,500 | $40,300 |
| 2022 | $2,096 | $45,300 | $6,700 | $38,600 |
| 2021 | $2,052 | $41,800 | $5,700 | $36,100 |
| 2020 | $2,039 | $40,000 | $5,700 | $34,300 |
| 2019 | $1,954 | $36,300 | $5,700 | $30,600 |
| 2018 | $1,832 | $32,000 | $5,700 | $26,300 |
| 2017 | $1,754 | $32,000 | $5,700 | $26,300 |
| 2016 | $1,677 | $31,400 | $5,700 | $25,700 |
| 2015 | $1,677 | $30,000 | $11,384 | $18,616 |
| 2014 | $1,677 | $29,400 | $9,287 | $20,113 |
Source: Public Records
Map
Nearby Homes
- 2305 Forest Ave
- 2418 Forest Ave
- 1917 Teel Ave
- 315 E Mount Hope Ave
- 1807 Teel Ave
- 1731 Herbert St
- 2118 Roberts Ln
- 328 W Greenlawn Ave
- 147 Isbell St
- 704 Mckim Ave
- 534 Isbell St
- 1824 Davis Ave
- 218 Dunlap St
- 215 Dunlap St
- 1917 Osband Ave
- 616 Isbell St
- 413 E Hodge Ave
- 334 Dunlap St
- 310 W Barnes Ave
- 205 Moores River Dr
Your Personal Tour Guide
Ask me questions while you tour the home.