Estimated Value: $219,000 - $356,000
3
Beds
2
Baths
2,253
Sq Ft
$129/Sq Ft
Est. Value
About This Home
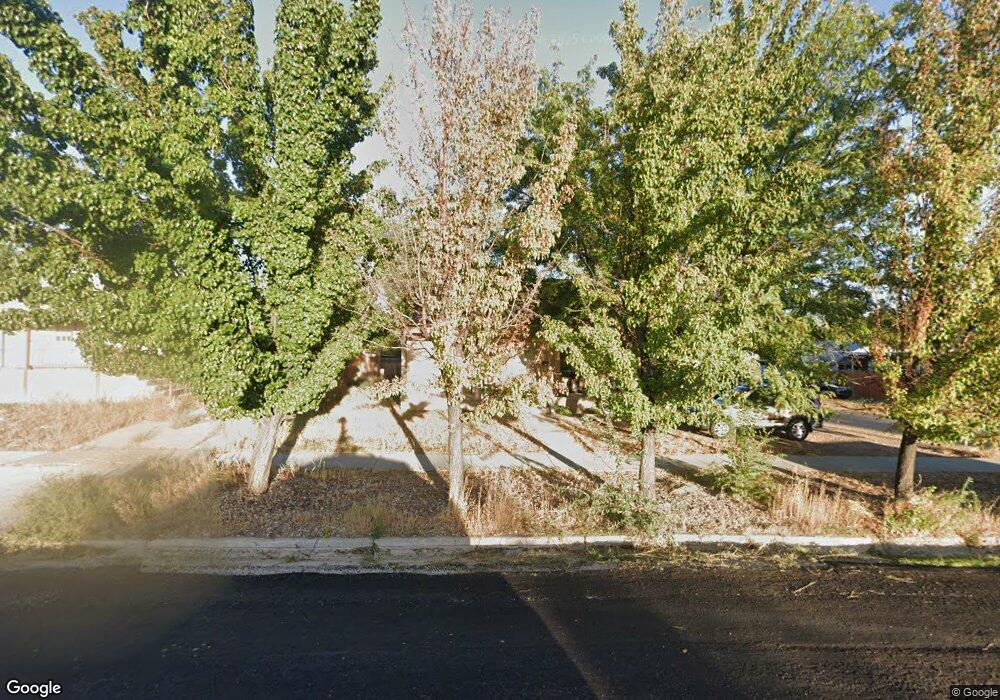
This home is located at 225 S 400 E, Price, UT 84501 and is currently estimated at $290,071, approximately $128 per square foot. 225 S 400 E is a home located in Carbon County with nearby schools including Wellington School, Mont Harmon Junior High School, and Carbon High School.
Ownership History
Date
Name
Owned For
Owner Type
Purchase Details
Closed on
Mar 5, 2022
Sold by
Allen Coker David and Tseng Houi-Lan
Bought by
Coker Miles
Current Estimated Value
Home Financials for this Owner
Home Financials are based on the most recent Mortgage that was taken out on this home.
Original Mortgage
$200,000
Outstanding Balance
$186,193
Interest Rate
3.92%
Mortgage Type
New Conventional
Estimated Equity
$103,878
Purchase Details
Closed on
Oct 1, 2021
Sold by
Whitten Patrick and Whitten Megan
Bought by
Cooker David Allen and Cooker Houi Lan
Purchase Details
Closed on
Oct 31, 2016
Sold by
Alger John and Alger Shirley
Bought by
Whitten Patrick and Whitten Megan
Home Financials for this Owner
Home Financials are based on the most recent Mortgage that was taken out on this home.
Original Mortgage
$131,313
Interest Rate
3.5%
Mortgage Type
New Conventional
Create a Home Valuation Report for This Property
The Home Valuation Report is an in-depth analysis detailing your home's value as well as a comparison with similar homes in the area
Purchase History
| Date | Buyer | Sale Price | Title Company |
|---|---|---|---|
| Coker Miles | -- | Professional Title Services | |
| Cooker David Allen | -- | South Eastern Utah Title Co | |
| Whitten Patrick | -- | South Easterin Utah Title Co |
Source: Public Records
Mortgage History
| Date | Status | Borrower | Loan Amount |
|---|---|---|---|
| Open | Coker Miles | $200,000 | |
| Previous Owner | Whitten Patrick | $131,313 |
Source: Public Records
Tax History
| Year | Tax Paid | Tax Assessment Tax Assessment Total Assessment is a certain percentage of the fair market value that is determined by local assessors to be the total taxable value of land and additions on the property. | Land | Improvement |
|---|---|---|---|---|
| 2025 | $942 | $77,517 | $12,271 | $65,246 |
| 2024 | $1,235 | $102,818 | $11,962 | $90,856 |
| 2023 | $1,491 | $132,426 | $8,432 | $123,994 |
| 2022 | $1,563 | $124,535 | $7,010 | $117,525 |
| 2021 | $1,339 | $165,552 | $10,710 | $154,842 |
| 2020 | $1,312 | $81,403 | $0 | $0 |
| 2019 | $819 | $53,257 | $0 | $0 |
| 2018 | $749 | $49,688 | $0 | $0 |
| 2017 | $739 | $49,688 | $0 | $0 |
| 2016 | $667 | $49,688 | $0 | $0 |
| 2015 | $667 | $49,688 | $0 | $0 |
| 2014 | $662 | $49,688 | $0 | $0 |
| 2013 | $611 | $45,387 | $0 | $0 |
Source: Public Records
Map
Nearby Homes
Your Personal Tour Guide
Ask me questions while you tour the home.