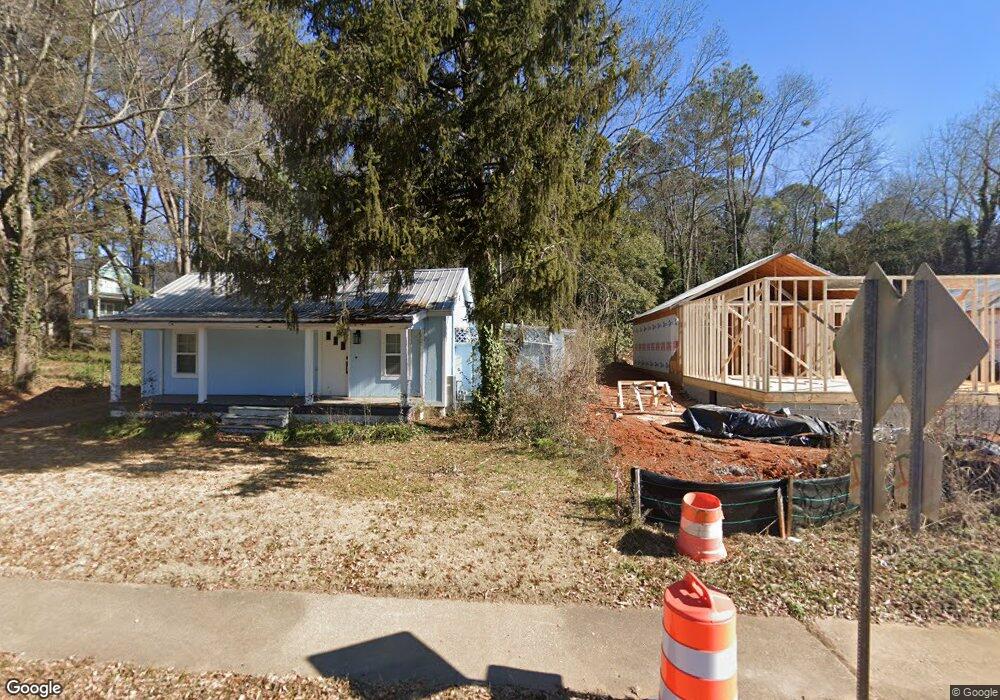
225 S Barnett Shoals Rd Athens, GA 30605
Estimated Value: $216,000 - $271,000
--
Bed
1
Bath
770
Sq Ft
$318/Sq Ft
Est. Value
About This Home
This home is located at 225 S Barnett Shoals Rd, Athens, GA 30605 and is currently estimated at $245,028, approximately $318 per square foot. 225 S Barnett Shoals Rd is a home located in Clarke County with nearby schools including Gaines Elementary School, Hilsman Middle School, and Cedar Shoals High School.
Ownership History
Date
Name
Owned For
Owner Type
Purchase Details
Closed on
Jul 15, 2020
Sold by
Innovative Property Solutions Llc
Bought by
Barnes Emile and Barnes Emile Cora
Current Estimated Value
Home Financials for this Owner
Home Financials are based on the most recent Mortgage that was taken out on this home.
Original Mortgage
$100,000
Outstanding Balance
$68,944
Interest Rate
3.1%
Mortgage Type
New Conventional
Estimated Equity
$176,084
Purchase Details
Closed on
Sep 24, 2018
Sold by
Dekle Realty Enterprises Llc
Bought by
Innovative Property Solutions Llc
Home Financials for this Owner
Home Financials are based on the most recent Mortgage that was taken out on this home.
Original Mortgage
$110,212
Interest Rate
4.5%
Mortgage Type
Commercial
Purchase Details
Closed on
Mar 11, 1999
Sold by
Dekle Thomas M
Bought by
Dekle Realty Enterprises Llc
Purchase Details
Closed on
Mar 15, 1993
Sold by
Kohlberg Bernard C
Bought by
Dekle Thomas M
Create a Home Valuation Report for This Property
The Home Valuation Report is an in-depth analysis detailing your home's value as well as a comparison with similar homes in the area
Home Values in the Area
Average Home Value in this Area
Purchase History
| Date | Buyer | Sale Price | Title Company |
|---|---|---|---|
| Barnes Emile | $135,000 | -- | |
| Innovative Property Solutions Llc | $69,000 | -- | |
| Dekle Realty Enterprises Llc | -- | -- | |
| Dekle Thomas M | $20,000 | -- |
Source: Public Records
Mortgage History
| Date | Status | Borrower | Loan Amount |
|---|---|---|---|
| Open | Barnes Emile | $100,000 | |
| Previous Owner | Innovative Property Solutions Llc | $110,212 |
Source: Public Records
Tax History Compared to Growth
Tax History
| Year | Tax Paid | Tax Assessment Tax Assessment Total Assessment is a certain percentage of the fair market value that is determined by local assessors to be the total taxable value of land and additions on the property. | Land | Improvement |
|---|---|---|---|---|
| 2024 | $3,052 | $92,692 | $12,000 | $80,692 |
| 2023 | $2,897 | $87,708 | $12,000 | $75,708 |
| 2022 | $2,488 | $77,983 | $10,400 | $67,583 |
| 2021 | $1,789 | $53,096 | $10,400 | $42,696 |
| 2020 | $823 | $24,410 | $8,000 | $16,410 |
| 2019 | $814 | $23,974 | $8,000 | $15,974 |
| 2018 | $602 | $17,735 | $8,000 | $9,735 |
| 2017 | $623 | $18,358 | $8,000 | $10,358 |
| 2016 | $623 | $18,353 | $8,000 | $10,353 |
| 2015 | $630 | $18,538 | $8,000 | $10,538 |
| 2014 | $644 | $18,907 | $8,000 | $10,907 |
Source: Public Records
Map
Nearby Homes
- 335 Barnett Shoals Rd
- 355 Barnett Shoals Rd
- 490 Barnett Shoals Rd Unit 820
- 490 Barnett Shoals Rd Unit 130
- 490 Barnett Shoals Rd Unit 406
- 490 Barnett Shoals Rd Unit 919
- 490 Barnett Shoals Rd Unit 819
- 490 Barnett Shoals Rd Unit 134
- 490 Barnett Shoals Rd Unit 536
- 1934 Lexington Rd
- 660 Barnett Shoals Rd Unit 213
- 170 Royal Ct
- 1995 Lexington Rd
- 210 Appleby Dr Unit 225
- 704 Branch St
- 332 Carr St
- 225 Barnett Shoals Rd
- 215 Barnett Shoals Rd
- 245 Barnett Shoals Rd
- 255 Barnett Shoals Rd
- 282 Johnson Dr
- 290 Johnson Dr
- 280 Johnson Dr
- 270 Johnson Dr
- 195 Barnett Shoals Rd
- 130 Johnson Drive Extension
- 260 Johnson Dr
- 250 Johnson Dr
- 240 Johnson Dr
- 143 Johnson Drive Extension
- 150 Johnson Dr
- 150 Johnson Drive Extension Unit A
- 150 Johnson Drive Extension
- 275 Johnson Dr
- 285 Johnson Dr
- 230 Johnson Dr