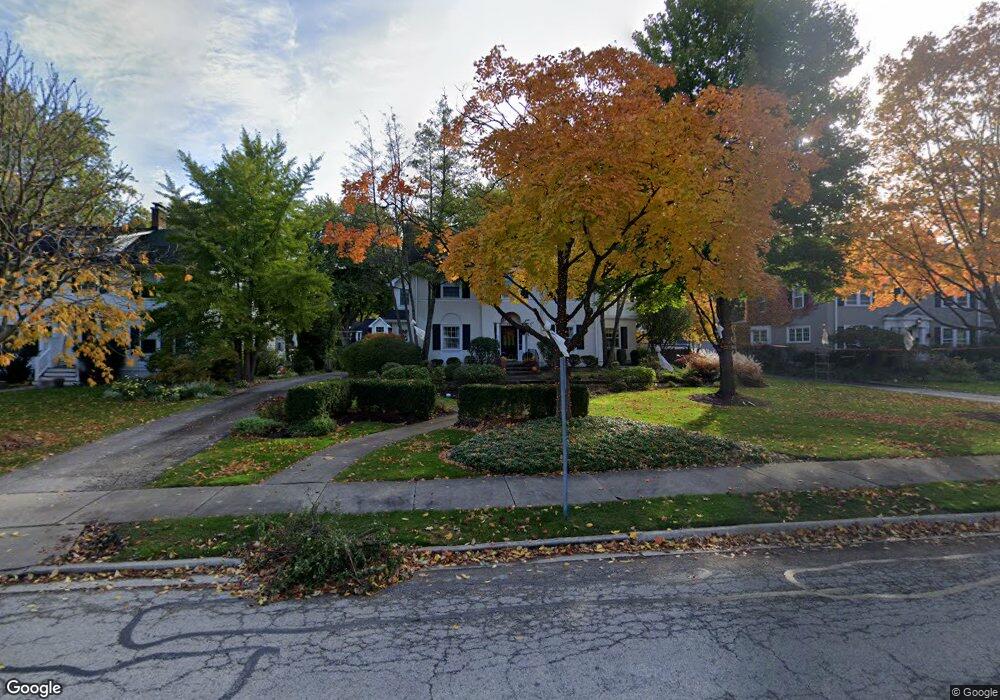
225 S Park Rd La Grange, IL 60525
Estimated Value: $1,400,471 - $2,306,000
4
Beds
4
Baths
3,883
Sq Ft
$443/Sq Ft
Est. Value
About This Home
This home is located at 225 S Park Rd, La Grange, IL 60525 and is currently estimated at $1,721,368, approximately $443 per square foot. 225 S Park Rd is a home located in Cook County with nearby schools including Cossitt Avenue Elementary School, Park Junior High School, and Lyons Township High School.
Ownership History
Date
Name
Owned For
Owner Type
Purchase Details
Closed on
May 1, 2017
Sold by
Bilecki Peter and Bilecki Larissa
Bought by
Bilecki Larissa J and Larissa J Bilecki Revocable Trust
Current Estimated Value
Purchase Details
Closed on
Feb 11, 2011
Sold by
Meyer Scott D and Meyer Christen D
Bought by
Bilecki Peter and Bilecki Larissa
Home Financials for this Owner
Home Financials are based on the most recent Mortgage that was taken out on this home.
Original Mortgage
$417,000
Outstanding Balance
$286,694
Interest Rate
4.88%
Mortgage Type
Stand Alone Second
Estimated Equity
$1,434,674
Purchase Details
Closed on
May 6, 1999
Sold by
Wojcik Mark S and Sumption Patricia M
Bought by
Meyer Scott D and Meyer Christen D
Home Financials for this Owner
Home Financials are based on the most recent Mortgage that was taken out on this home.
Original Mortgage
$570,000
Interest Rate
7.04%
Create a Home Valuation Report for This Property
The Home Valuation Report is an in-depth analysis detailing your home's value as well as a comparison with similar homes in the area
Home Values in the Area
Average Home Value in this Area
Purchase History
| Date | Buyer | Sale Price | Title Company |
|---|---|---|---|
| Bilecki Larissa J | -- | None Available | |
| Bilecki Peter | $950,000 | Bt | |
| Meyer Scott D | $822,000 | -- |
Source: Public Records
Mortgage History
| Date | Status | Borrower | Loan Amount |
|---|---|---|---|
| Open | Bilecki Peter | $417,000 | |
| Previous Owner | Meyer Scott D | $570,000 |
Source: Public Records
Tax History Compared to Growth
Tax History
| Year | Tax Paid | Tax Assessment Tax Assessment Total Assessment is a certain percentage of the fair market value that is determined by local assessors to be the total taxable value of land and additions on the property. | Land | Improvement |
|---|---|---|---|---|
| 2024 | $24,360 | $110,000 | $17,100 | $92,900 |
| 2023 | $23,127 | $101,517 | $17,100 | $84,417 |
| 2022 | $23,127 | $82,183 | $12,825 | $69,358 |
| 2021 | $22,240 | $82,183 | $12,825 | $69,358 |
| 2020 | $21,830 | $82,183 | $12,825 | $69,358 |
| 2019 | $24,107 | $90,809 | $11,756 | $79,053 |
| 2018 | $23,646 | $90,809 | $11,756 | $79,053 |
| 2017 | $23,036 | $90,809 | $11,756 | $79,053 |
| 2016 | $23,180 | $81,718 | $10,331 | $71,387 |
| 2015 | $21,634 | $81,718 | $10,331 | $71,387 |
| 2014 | $21,307 | $81,718 | $10,331 | $71,387 |
| 2013 | $20,567 | $77,850 | $10,331 | $67,519 |
Source: Public Records
Map
Nearby Homes
- 518 W Cossitt Ave
- 509 S Brainard Ave
- 27 S Waiola Ave Unit 103
- 413 S Kensington Ave
- 1105 W Hillgrove Ave Unit 4
- 334 S Ashland Ave
- 500 S Edgewood Ave
- 17-19 N Brainard Ave
- 20 N Edgewood Ave
- 48 N Park Rd
- 33 N Stone Ave
- 405 S Gilbert Ave
- 524 S Ashland Ave
- 17 S Madison Ave
- 709 Bell Ave
- 430 S La Grange Rd
- 4537 Clausen Ave
- 510 S 6th Ave
- 715 S Catherine Ave
- 25 S La Grange Rd Unit E
- 217 S Park Rd
- 233 S Park Rd
- 224 S Brainard Ave
- 220 S Brainard Ave
- 211 S Park Rd
- 230 S Brainard Ave
- 218 S Brainard Ave
- 234 S Brainard Ave
- 212 S Brainard Ave
- 236 S Brainard Ave
- 208 S Brainard Ave
- 222 S Park Rd
- 230 S Park Rd
- 201 S Park Rd
- 240 S Brainard Ave
- 240 S Brainard Ave Unit 1
- 240 S Brainard Ave
- 204 S Brainard Ave
- 234 S Park Rd
- 210 S Park Rd