
Seller's Agent in 2012
Sue Ellett
Spyglass Realty
(512) 422-7182
60 Total Sales
Estimated Value: $147,020 - $536,000
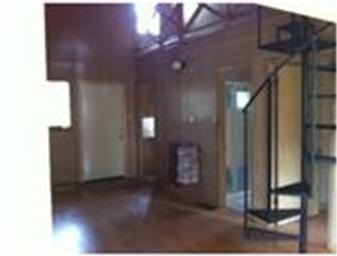
Use your creativity and this cute be really adorable. A-Frame type structure with large deck on 6 lots. Sold As-Is. Needs some updating, but basics are there. Loft area upstairs runs the full length of the home so room to expand and create bedrooms, play area, study, or??? At this price, the options are endless, Lots can be subdivided.
Last Buyer's Agent
Non Member
Non Member License #785011
| Date | Event | Price | Change | Sq Ft Price |
|---|---|---|---|---|
| 07/20/2012 07/20/12 | Sold | -- | -- | -- |
| 06/22/2012 06/22/12 | Pending | -- | -- | -- |
| 05/03/2012 05/03/12 | For Sale | $45,000 | -- | $70 / Sq Ft |
| Year | Tax Paid | Tax Assessment Tax Assessment Total Assessment is a certain percentage of the fair market value that is determined by local assessors to be the total taxable value of land and additions on the property. | Land | Improvement |
|---|---|---|---|---|
| 2023 | $2,169 | $111,740 | $8,000 | $103,740 |
| 2022 | $2,108 | $104,179 | $8,000 | $96,179 |
| 2021 | $1,268 | $57,898 | $5,750 | $52,148 |
| 2020 | $1,053 | $47,773 | $4,250 | $43,523 |
| 2019 | $1,070 | $47,273 | $3,750 | $43,523 |
| 2018 | $1,007 | $44,820 | $3,000 | $41,820 |
| 2017 | $858 | $38,412 | $3,000 | $35,412 |
| 2016 | $805 | $36,060 | $2,250 | $33,810 |
| 2015 | -- | $36,060 | $2,250 | $33,810 |
| 2014 | -- | $33,827 | $2,250 | $31,577 |
Seller's Agent in 2012
Sue Ellett
Spyglass Realty
(512) 422-7182
60 Total Sales
N
Buyer's Agent in 2012
Non Member
Non Member
Source: Unlock MLS (Austin Board of REALTORS®)
MLS Number: 9781063
APN: 39947
Disclaimer: Certain information contained herein is derived from information provided by parties other than Homes.com. All information provided is deemed reliable, but is not guaranteed to be accurate and should be independently verified.
![]() Based on information from the Austin Board of REALTORS® (alternatively, from ACTRIS). Neither the Board nor ACTRIS guarantees or is in any way responsible for its accuracy. All data is provided “AS IS” and with all faults. Data maintained by the Board or ACTRIS may not reflect all real estate activity in the market.
Based on information from the Austin Board of REALTORS® (alternatively, from ACTRIS). Neither the Board nor ACTRIS guarantees or is in any way responsible for its accuracy. All data is provided “AS IS” and with all faults. Data maintained by the Board or ACTRIS may not reflect all real estate activity in the market.
Information being provided is for consumers’ personal, non-commercial use and may not be used for any purpose other than to identify prospective properties consumers may be interested in purchasing.
The Digital Millennium Copyright Act of 1998, 17 U.S.C. § 512 (the “DMCA”) provides recourse for copyright owners who believe that material appearing on the Internet infringes their rights under U.S. copyright law. If you believe in good faith that any content or material made available in connection with our website or services infringes your copyright, you (or your agent) may send us a notice requesting that the content or material be removed, or access to it blocked.
Notices must be sent in writing by email to DMCAnotice@MLSGrid.com.
The DMCA requires that your notice of alleged copyright infringement include the following information:
(1) description of the copyrighted work that is the subject of claimed infringement;
(2) description of the alleged infringing content and information sufficient to permit us to locate the content;
(3) contact information for you, including your address, telephone number and email address;
(4) a statement by you that you have a good faith belief that the content in the manner complained of is not authorized by the copyright owner, or its agent, or by the operation of any law;
(5) a statement by you, signed under penalty of perjury, that the information in the notification is accurate and that you have the authority to enforce the copyrights that are claimed to be infringed; and
(6) a physical or electronic signature of the copyright owner or a person authorized to act on the copyright owner’s behalf. Failure to include all of the above information may result in the delay of the processing of your complaint.