Estimated Value: $494,000 - $713,000
--
Bed
3
Baths
3,636
Sq Ft
$165/Sq Ft
Est. Value
About This Home
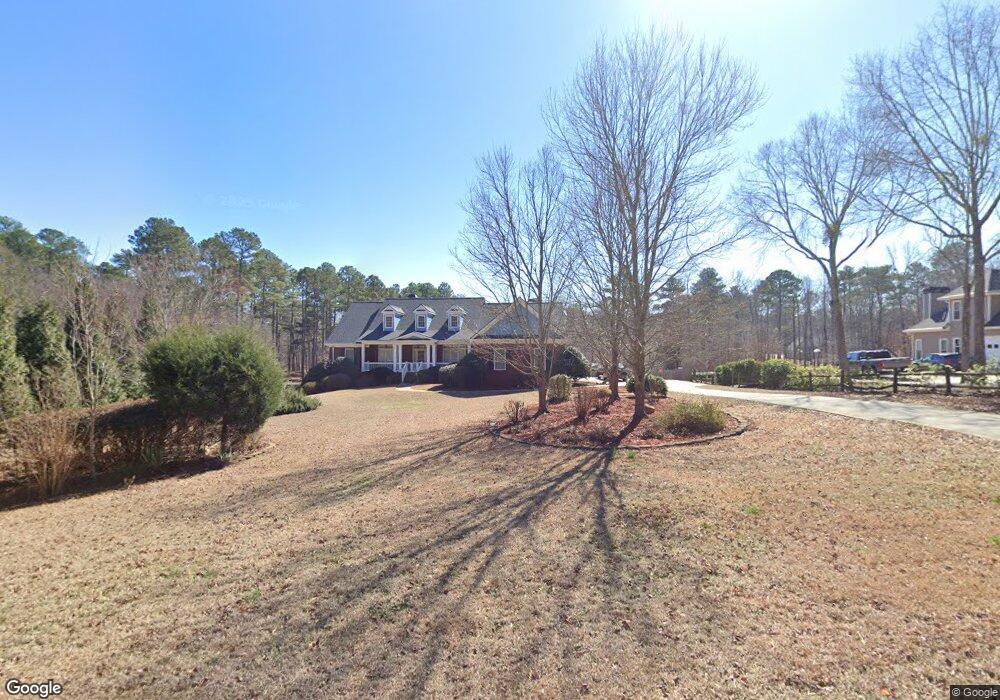
This home is located at 225 Spratlin Way, Hull, GA 30646 and is currently estimated at $600,726, approximately $165 per square foot. 225 Spratlin Way is a home located in Madison County with nearby schools including Madison County High School.
Ownership History
Date
Name
Owned For
Owner Type
Purchase Details
Closed on
Mar 2, 2011
Sold by
Burroughs Lee D
Bought by
Burroughs Lee D and Burroughs Donald J
Current Estimated Value
Home Financials for this Owner
Home Financials are based on the most recent Mortgage that was taken out on this home.
Original Mortgage
$207,000
Outstanding Balance
$9,540
Interest Rate
4.77%
Mortgage Type
New Conventional
Estimated Equity
$591,186
Purchase Details
Closed on
Mar 1, 2006
Sold by
Moon Michael
Bought by
Moon Lee
Purchase Details
Closed on
Jun 16, 2004
Sold by
Watson Jody
Bought by
Moon Michael V and Moon Lee D
Purchase Details
Closed on
Jan 22, 2004
Sold by
Shaefer Heard Inc
Bought by
Watson Jody
Purchase Details
Closed on
Sep 4, 2002
Sold by
Mcclellan William Ki
Bought by
Stallings James K
Purchase Details
Closed on
Apr 19, 2002
Sold by
Bullock Morris J
Bought by
Mcclellan William Ki
Create a Home Valuation Report for This Property
The Home Valuation Report is an in-depth analysis detailing your home's value as well as a comparison with similar homes in the area
Home Values in the Area
Average Home Value in this Area
Purchase History
| Date | Buyer | Sale Price | Title Company |
|---|---|---|---|
| Burroughs Lee D | -- | -- | |
| Moon Lee | -- | -- | |
| Moon Michael V | $318,000 | -- | |
| Watson Jody | $39,000 | -- | |
| Shaefer Heard Inc | $256,000 | -- | |
| Stallings James K | $231,300 | -- | |
| Mcclellan William Ki | $225,000 | -- |
Source: Public Records
Mortgage History
| Date | Status | Borrower | Loan Amount |
|---|---|---|---|
| Open | Burroughs Lee D | $207,000 |
Source: Public Records
Tax History Compared to Growth
Tax History
| Year | Tax Paid | Tax Assessment Tax Assessment Total Assessment is a certain percentage of the fair market value that is determined by local assessors to be the total taxable value of land and additions on the property. | Land | Improvement |
|---|---|---|---|---|
| 2024 | $4,912 | $190,735 | $16,000 | $174,735 |
| 2023 | $5,522 | $180,890 | $16,000 | $164,890 |
| 2022 | $4,476 | $164,292 | $16,000 | $148,292 |
| 2021 | $4,103 | $136,400 | $16,000 | $120,400 |
| 2020 | $4,131 | $136,400 | $16,000 | $120,400 |
| 2019 | $3,772 | $123,291 | $16,000 | $107,291 |
| 2018 | $3,757 | $122,466 | $16,000 | $106,466 |
| 2017 | $3,572 | $124,046 | $16,000 | $108,046 |
| 2016 | $3,147 | $111,648 | $16,000 | $95,648 |
| 2015 | $2,871 | $101,970 | $16,000 | $85,970 |
| 2014 | $2,905 | $102,541 | $16,000 | $86,541 |
| 2013 | -- | $102,541 | $16,000 | $86,541 |
Source: Public Records
Map
Nearby Homes
- 210 Joe Graham Rd
- 1329 Spratlin Mill Dr
- 0 Spratlin Mill Dr Unit 7665837
- 0 Spratlin Mill Dr Unit LOT 14-C
- 7241 Highway 29 S
- 151 Rolling Woods Ln
- 6716 U S 29
- 1330 McCannon-morris Rd
- 1270 McCannon Morris Rd
- 149 Candlestick Dr
- 103 Three Rivers Ct
- 385 McCannon Morris Rd
- 660 McCannon Morris Rd
- 0 Spratlin Mill Rd Unit 1025918
- 0 Spratlin Mill Rd Unit 10526335
- 703 Jack Sharp Rd
- 0 Virginia Ln Unit Lot 15 CL336098
- 0 Virginia Ln Unit LOT 15 10579204
- 119 Jack Sharp Rd
- 838 Virginia Ln
- Lot 19A Spratlin Way
- Lot 12A Spratlin Way
- Lot 14A Spratlin Way
- Lot 15A Spratlin Way
- Lot 13A Spratlin Way
- Lot 16A Spratlin Way
- Lot 20A Spratlin Way
- Lot 10A Spratlin Way
- Lot 11A Spratlin Way
- 0000 Spratlin Way
- 265 Spratlin Way
- 145 Spratlin Way
- 165 Spratlin Way
- 295 Spratlin Way
- 335 Spratlin Way
- 596 Spratlin Mill Dr
- 0 Spratlin Way Unit 7281047
- 0 Spratlin Way Unit 3094064
- 0 Spratlin Way Unit 3145010
- 0 Spratlin Way Unit 7067436