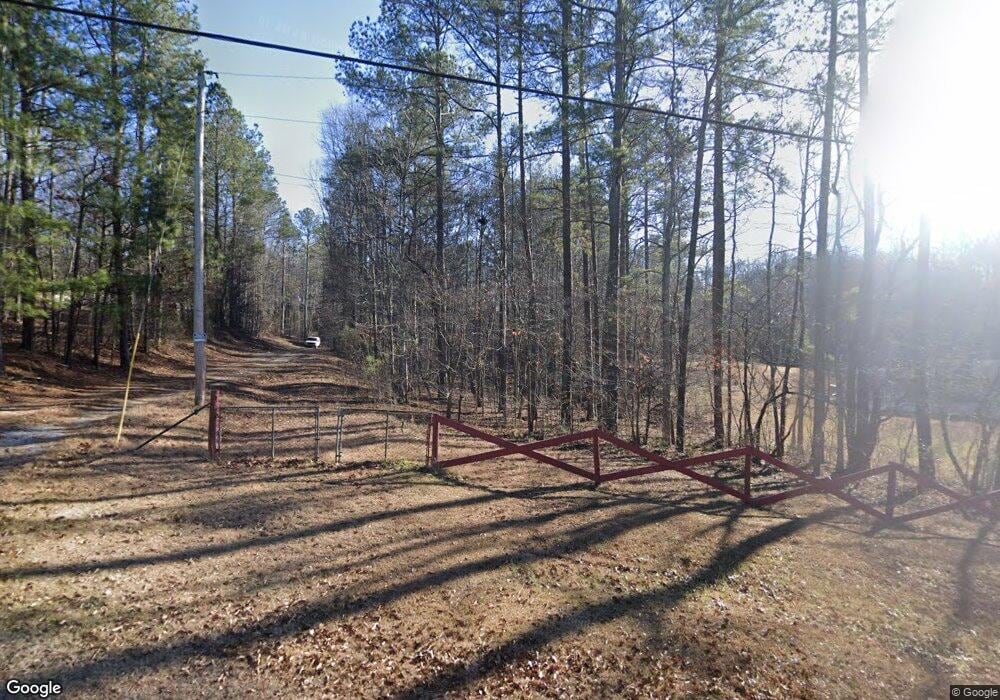
225 Sweetwater Trail Villa Rica, GA 30180
Estimated Value: $181,000 - $254,037
2
Beds
2
Baths
960
Sq Ft
$230/Sq Ft
Est. Value
About This Home
This home is located at 225 Sweetwater Trail, Villa Rica, GA 30180 and is currently estimated at $221,259, approximately $230 per square foot. 225 Sweetwater Trail is a home located in Carroll County with nearby schools including Glanton-Hindsman Elementary School, Villa Rica Middle School, and Villa Rica High School.
Ownership History
Date
Name
Owned For
Owner Type
Purchase Details
Closed on
Nov 7, 2020
Sold by
Kkc Maryland Advisors
Bought by
Mng 401K Psp
Current Estimated Value
Purchase Details
Closed on
Jan 27, 2020
Sold by
Colonial Impact Fund Ii Llc
Bought by
Maryland Advisors Llc
Purchase Details
Closed on
Jan 14, 2019
Sold by
Flat Iron Holdings Llc
Bought by
Colonial Impact Fund Ii Llc
Purchase Details
Closed on
Sep 28, 2012
Sold by
Mom Haven 13 Lp
Bought by
Flat Iron Holdings Llc
Purchase Details
Closed on
May 23, 2011
Sold by
Springleaf Financial Svcs Inc
Bought by
Mom Haven 13 Lp
Purchase Details
Closed on
Mar 1, 2011
Sold by
Gates Lamar
Bought by
American General Financial Services Inc
Purchase Details
Closed on
Feb 22, 2001
Sold by
Butler Ronald E
Bought by
Gates Lamar
Purchase Details
Closed on
Feb 1, 1994
Bought by
Gould Myles J
Create a Home Valuation Report for This Property
The Home Valuation Report is an in-depth analysis detailing your home's value as well as a comparison with similar homes in the area
Home Values in the Area
Average Home Value in this Area
Purchase History
| Date | Buyer | Sale Price | Title Company |
|---|---|---|---|
| Mng 401K Psp | -- | -- | |
| Maryland Advisors Llc | $37,950 | -- | |
| Colonial Impact Fund Ii Llc | -- | -- | |
| Flat Iron Holdings Llc | -- | -- | |
| Mom Haven 13 Lp | $16,500 | -- | |
| American General Financial Services Inc | $50,000 | -- | |
| Gates Lamar | $30,000 | -- | |
| Butler Ronald E | $12,500 | -- | |
| Gould Myles J | -- | -- |
Source: Public Records
Tax History Compared to Growth
Tax History
| Year | Tax Paid | Tax Assessment Tax Assessment Total Assessment is a certain percentage of the fair market value that is determined by local assessors to be the total taxable value of land and additions on the property. | Land | Improvement |
|---|---|---|---|---|
| 2024 | $1,264 | $55,868 | $14,480 | $41,388 |
| 2023 | $1,264 | $52,146 | $14,480 | $37,666 |
| 2022 | $1,202 | $47,918 | $14,480 | $33,438 |
| 2021 | $1,106 | $43,122 | $14,480 | $28,642 |
| 2020 | $1,031 | $40,171 | $14,480 | $25,691 |
| 2019 | $973 | $37,605 | $14,480 | $23,125 |
| 2018 | $893 | $34,000 | $14,480 | $19,520 |
| 2017 | $896 | $34,000 | $14,480 | $19,520 |
| 2016 | $896 | $34,000 | $14,480 | $19,520 |
| 2015 | $641 | $22,918 | $8,288 | $14,630 |
| 2014 | $644 | $22,918 | $8,288 | $14,630 |
Source: Public Records
Map
Nearby Homes
- 114 Clay Ct
- 232 Harlan Heights Rd
- 84 Ledbetter Rd
- 141 Ledbetter Rd
- 1180 Harlan Lane Rd
- 37 Tapley Rd
- 1052 Harlan Lane Rd
- 104 Dalton Dr
- 213 Cornell Ct
- 101 Cedars Glen Cir
- 100 Cedars Glen Cir
- 337 Cranmore Place
- 17 Cedars Glen Place
- 178 Cedars Glen Cir
- 227 Cedars Glen Cir
- 132 Hunters Lake Dr
- 104 Amidon Dr
- 504 Iris Way