225 Tiny Springs Rd Swansea, SC 29160
Sandy Run NeighborhoodEstimated Value: $64,000 - $201,000
4
Beds
1
Bath
1,836
Sq Ft
$72/Sq Ft
Est. Value
About This Home
This home is located at 225 Tiny Springs Rd, Swansea, SC 29160 and is currently estimated at $132,500, approximately $72 per square foot. 225 Tiny Springs Rd is a home located in Lexington County with nearby schools including Sandhills Primary School, Sandhills Elementary School, and Swansea High Freshman Academy.
Ownership History
Date
Name
Owned For
Owner Type
Purchase Details
Closed on
Jun 21, 2021
Sold by
Wells Fargo Bank Na
Bought by
Nystrom Barbara D and Nystrom Paul G
Current Estimated Value
Purchase Details
Closed on
Jun 10, 2021
Sold by
Federal Home Loan Mortgage Corporation
Bought by
Wells Fargo Bank Na
Purchase Details
Closed on
May 17, 2017
Sold by
Wells Fargo Bank Na
Bought by
Federal Home Loan Mortgage Corp
Purchase Details
Closed on
Jun 23, 2016
Sold by
Master Of Lexington County
Bought by
Wells Fargo Bank Na
Purchase Details
Closed on
Aug 30, 2013
Sold by
D & D Associates
Bought by
Wells Fargo Bank Na
Purchase Details
Closed on
Feb 22, 2013
Sold by
Bryan John R and Bryan Steven T
Bought by
D & D Associates
Purchase Details
Closed on
Oct 6, 2010
Sold by
Bryan John R and Bryan Steven T
Bought by
Taylor Wanda L
Purchase Details
Closed on
Feb 9, 2009
Sold by
Bryan Juanita C
Bought by
Bryan John R and Bryan Steven T
Create a Home Valuation Report for This Property
The Home Valuation Report is an in-depth analysis detailing your home's value as well as a comparison with similar homes in the area
Home Values in the Area
Average Home Value in this Area
Purchase History
| Date | Buyer | Sale Price | Title Company |
|---|---|---|---|
| Nystrom Barbara D | $21,000 | None Available | |
| Wells Fargo Bank Na | -- | None Available | |
| Federal Home Loan Mortgage Corp | -- | None Available | |
| Wells Fargo Bank Na | $34,125 | None Available | |
| Wells Fargo Bank Na | $1,000 | -- | |
| D & D Associates | $1,710 | -- | |
| Taylor Wanda L | -- | -- | |
| Bryan John R | -- | -- |
Source: Public Records
Mortgage History
| Date | Status | Borrower | Loan Amount |
|---|---|---|---|
| Closed | Wells Fargo Bank Na | $0 |
Source: Public Records
Tax History Compared to Growth
Tax History
| Year | Tax Paid | Tax Assessment Tax Assessment Total Assessment is a certain percentage of the fair market value that is determined by local assessors to be the total taxable value of land and additions on the property. | Land | Improvement |
|---|---|---|---|---|
| 2024 | $192 | $420 | $420 | $0 |
| 2023 | $192 | $420 | $420 | $0 |
| 2022 | $193 | $420 | $420 | $0 |
| 2020 | $1,338 | $2,898 | $420 | $2,478 |
| 2019 | $1,453 | $3,040 | $270 | $2,770 |
| 2018 | $1,405 | $3,040 | $270 | $2,770 |
| 2017 | $1,384 | $3,040 | $270 | $2,770 |
| 2016 | $1,256 | $3,040 | $270 | $2,770 |
| 2014 | $1,436 | $3,432 | $420 | $3,012 |
| 2013 | -- | $2,290 | $280 | $2,010 |
Source: Public Records
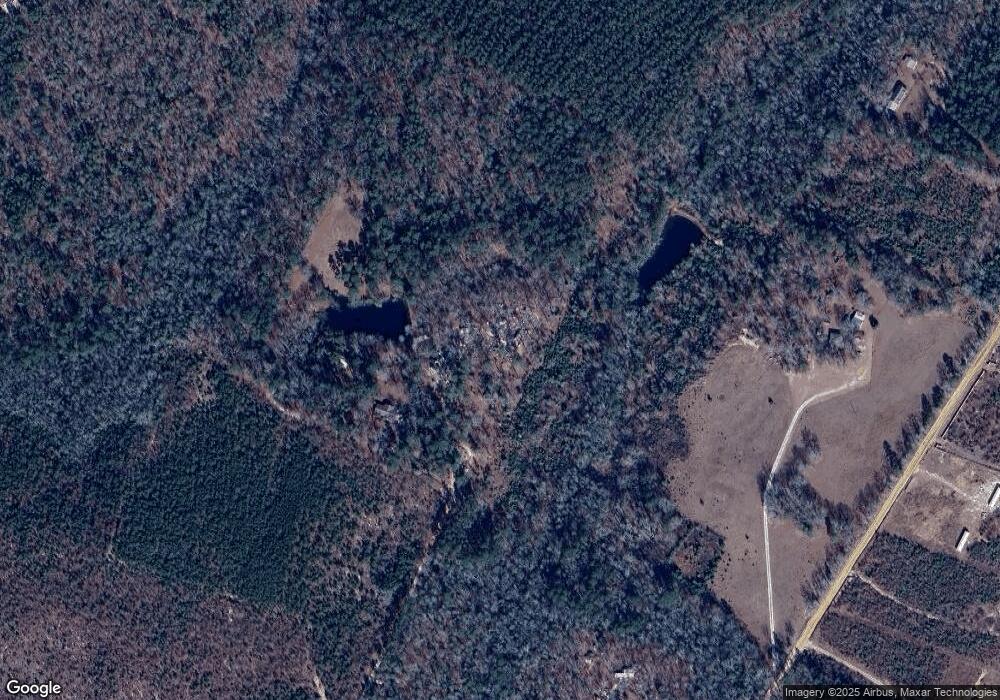
Map
Nearby Homes
- 648 Calvary Church Rd
- 1012 Calvary Church Rd
- 225 Jim Rucker Rd
- 221 Jim Rucker Rd
- 560 Beaver Creek Rd
- 0 Hubbs Rd
- 99.93 Acres Glovers Chapel Way
- 16 Catalina Blvd
- 14 Catalina Blvd
- 12 Catalina Blvd
- 10 Catalina Blvd
- 6 Catalina Blvd
- TBD Horses Neck Rd
- 1203 Basil Rd
- 17 Catalina Blvd
- 15 Catalina Blvd
- 13 Catalina Blvd
- 11 Catalina Blvd
- 5 Catalina Blvd
- 1020 Basil Rd
- 225 Tiny Springs Rd
- 221 Tiny Springs Rd
- 345 Jeffcoat Rd
- 315 Jeffcoat Rd
- 541 Jeffcoat Rd
- 847 Calvary Church Rd
- 372 Jeffcoat Rd
- 201 Bub Wise Rd
- 207 Bub Wise Rd
- 183 Bub Wise Rd
- 180 Bub Wise Rd
- 141 Jeffcoat Rd
- 218 Bub Wise Rd
- 168 Bub Wise Rd
- 306 Bub Wise Rd
- 736 Beaver Creek Rd
- 131 Bub Wise Rd
- 192 Bub Wise Rd
- 877 Calvary Church Rd
- 304 Bub Wise Rd