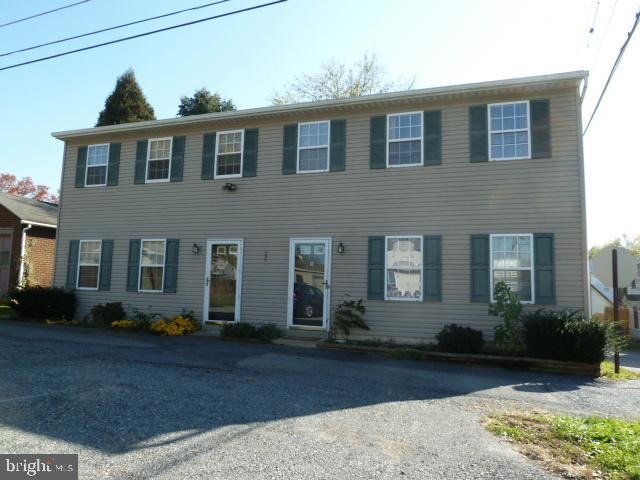
225 Trap Alley Bainbridge, PA 17502
Estimated Value: $286,000 - $411,000
Highlights
- Traditional Architecture
- No HOA
- Built-In Features
- Bainbridge Elementary School Rated A-
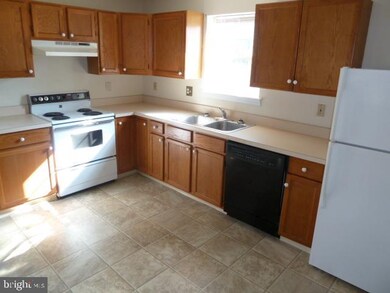
- Eat-In Kitchen
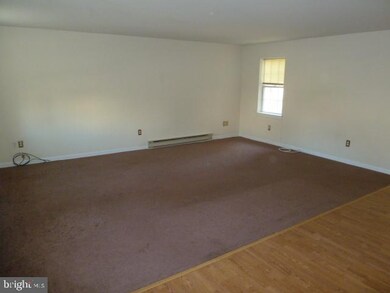
- Living Room
About This Home
As of November 2012NEED MORTGAGE HELP? 2 unit w/ separated utilities W-S-E! One Unit rented $850 per month 2nd unit is "move in" ready! LIVE HERE FOR ONLY - $416.77 Per Mo.(Apr 4.576%) Look at the numbers! - FHA 3.5% down - Loan amount: $173,603.50 - Term 30 years - Rate 3.75% - PITI Payment: $1,266.77 (w/ est. Ins. of $720 year)
Townhouse Details
Home Type
- Townhome
Est. Annual Taxes
- $2,878
Year Built
- Built in 1994
Lot Details
- 2,614 Sq Ft Lot
- Board Fence
Home Design
- Semi-Detached or Twin Home
- Traditional Architecture
- Shingle Roof
- Composition Roof
- Vinyl Siding
- Stick Built Home
Interior Spaces
- 2,656 Sq Ft Home
- Property has 2 Levels
- Built-In Features
- Insulated Windows
- Living Room
- Laundry Room
Kitchen
- Eat-In Kitchen
- Electric Oven or Range
- Dishwasher
Bedrooms and Bathrooms
- 6 Bedrooms
Basement
- Partial Basement
- Exterior Basement Entry
Home Security
Parking
- 5 Parking Spaces
- Off-Street Parking
Outdoor Features
- Shed
Schools
- Elizabethtown Area Middle School
- Elizabethtown Area High School
Utilities
- Baseboard Heating
- 200+ Amp Service
- Electric Water Heater
- Cable TV Available
Community Details
- No Home Owners Association
- Storm Doors
Listing and Financial Details
- Assessor Parcel Number 1304838300000
Ownership History
Purchase Details
Home Financials for this Owner
Home Financials are based on the most recent Mortgage that was taken out on this home.Purchase Details
Home Financials for this Owner
Home Financials are based on the most recent Mortgage that was taken out on this home.Purchase Details
Home Financials for this Owner
Home Financials are based on the most recent Mortgage that was taken out on this home.Home Values in the Area
Average Home Value in this Area
Purchase History
| Date | Buyer | Sale Price | Title Company |
|---|---|---|---|
| Thorpe Thor T | $150,000 | None Available | |
| Keagy Paul L | $155,000 | None Available | |
| Stiver Richard L | $25,000 | -- |
Mortgage History
| Date | Status | Borrower | Loan Amount |
|---|---|---|---|
| Open | Thorpe Thor T | $122,500 | |
| Previous Owner | Keagy Paul L | $120,000 | |
| Previous Owner | Stiver Richard L | $16,803 |
Property History
| Date | Event | Price | Change | Sq Ft Price |
|---|---|---|---|---|
| 11/15/2012 11/15/12 | Sold | $150,000 | 0.0% | $56 / Sq Ft |
| 11/15/2012 11/15/12 | Sold | $150,000 | -16.6% | $56 / Sq Ft |
| 09/12/2012 09/12/12 | Pending | -- | -- | -- |
| 09/12/2012 09/12/12 | Pending | -- | -- | -- |
| 12/15/2011 12/15/11 | For Sale | $179,900 | 0.0% | $68 / Sq Ft |
| 11/10/2011 11/10/11 | For Sale | $179,900 | -- | $68 / Sq Ft |
Tax History Compared to Growth
Tax History
| Year | Tax Paid | Tax Assessment Tax Assessment Total Assessment is a certain percentage of the fair market value that is determined by local assessors to be the total taxable value of land and additions on the property. | Land | Improvement |
|---|---|---|---|---|
| 2025 | $4,511 | $199,800 | $25,200 | $174,600 |
| 2024 | $4,511 | $199,800 | $25,200 | $174,600 |
| 2023 | $4,300 | $199,800 | $25,200 | $174,600 |
| 2022 | $4,191 | $199,800 | $25,200 | $174,600 |
| 2021 | $3,996 | $199,800 | $25,200 | $174,600 |
| 2020 | $3,996 | $199,800 | $25,200 | $174,600 |
| 2019 | $3,900 | $199,800 | $25,200 | $174,600 |
| 2018 | $3,318 | $199,800 | $25,200 | $174,600 |
| 2017 | $3,193 | $135,100 | $24,100 | $111,000 |
| 2016 | $3,193 | $135,100 | $24,100 | $111,000 |
| 2015 | $505 | $135,100 | $24,100 | $111,000 |
| 2014 | $2,482 | $135,100 | $24,100 | $111,000 |
Map
Source: Bright MLS
MLS Number: 1004526693
APN: 130-48383-0-0000
Disclaimer: Certain information contained herein is derived from information provided by parties other than Homes.com. All information provided is deemed reliable, but is not guaranteed to be accurate and should be independently verified.
![]() The data relating to real estate for sale on this website appears in part through the BRIGHT Internet Data Exchange program, a voluntary cooperative exchange of property listing data between licensed real estate brokerage firms, and is provided by BRIGHT through a licensing agreement.
The data relating to real estate for sale on this website appears in part through the BRIGHT Internet Data Exchange program, a voluntary cooperative exchange of property listing data between licensed real estate brokerage firms, and is provided by BRIGHT through a licensing agreement.
Listing information is from various brokers who participate in the Bright MLS IDX program and not all listings may be visible on the site.
The property information being provided on or through the website is for the personal, non-commercial use of consumers and such information may not be used for any purpose other than to identify prospective properties consumers may be interested in purchasing.
Some properties which appear for sale on the website may no longer be available because they are for instance, under contract, sold or are no longer being offered for sale.
Property information displayed is deemed reliable but is not guaranteed.
Copyright 2025 Bright MLS, Inc.
- 303 Walnut St
- 254 Walnut St
- 1228 Sagerville Rd
- 1406 Amosite Rd
- 765 Market St
- 900 2nd St
- 535 Wago Rd
- 429 Pebble Beach Dr
- 160 Payne Dr
- 870 Conewago Ave
- 123 Fallsview Ave
- 55 Highland Ave
- 20 Burberry Ln
- 2580 York Haven Rd
- 140 Village Rd
- 185 Hollyhock Dr
- 161 N 3rd St
- 143 N 2nd St
- 505 Abbey Dr
- 116 N 2nd St