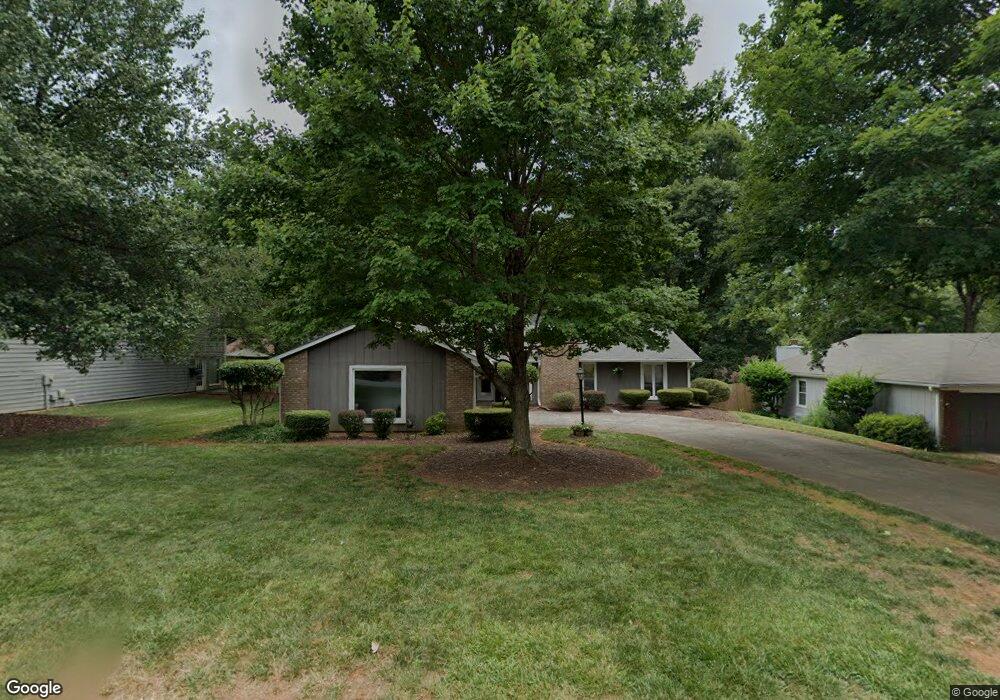
225 Truehedge Trace Unit 2 Roswell, GA 30076
Martin's Landing NeighborhoodEstimated Value: $477,322 - $523,000
3
Beds
2
Baths
1,808
Sq Ft
$278/Sq Ft
Est. Value
About This Home
This home is located at 225 Truehedge Trace Unit 2, Roswell, GA 30076 and is currently estimated at $502,831, approximately $278 per square foot. 225 Truehedge Trace Unit 2 is a home located in Fulton County with nearby schools including Jackson Elementary School, Holcomb Bridge Middle School, and Centennial High School.
Ownership History
Date
Name
Owned For
Owner Type
Purchase Details
Closed on
Jan 19, 2018
Sold by
Lindner V Mary V
Bought by
Lindner Mary Virginia Trustee and Lindner Mary Virginia Living T
Current Estimated Value
Purchase Details
Closed on
Dec 4, 1997
Sold by
Hall Linda G
Bought by
Lindner Mary
Home Financials for this Owner
Home Financials are based on the most recent Mortgage that was taken out on this home.
Original Mortgage
$106,800
Interest Rate
7.18%
Mortgage Type
New Conventional
Create a Home Valuation Report for This Property
The Home Valuation Report is an in-depth analysis detailing your home's value as well as a comparison with similar homes in the area
Home Values in the Area
Average Home Value in this Area
Purchase History
| Date | Buyer | Sale Price | Title Company |
|---|---|---|---|
| Lindner Mary Virginia Trustee | -- | -- | |
| Lindner Mary | $142,500 | -- |
Source: Public Records
Mortgage History
| Date | Status | Borrower | Loan Amount |
|---|---|---|---|
| Previous Owner | Lindner Mary | $106,800 |
Source: Public Records
Tax History Compared to Growth
Tax History
| Year | Tax Paid | Tax Assessment Tax Assessment Total Assessment is a certain percentage of the fair market value that is determined by local assessors to be the total taxable value of land and additions on the property. | Land | Improvement |
|---|---|---|---|---|
| 2025 | $457 | $153,720 | $46,400 | $107,320 |
| 2023 | $4,294 | $152,120 | $44,160 | $107,960 |
| 2022 | $1,605 | $128,360 | $32,800 | $95,560 |
| 2021 | $1,929 | $112,920 | $21,960 | $90,960 |
| 2020 | $1,950 | $104,480 | $27,840 | $76,640 |
| 2019 | $509 | $102,680 | $27,360 | $75,320 |
| 2018 | $1,847 | $88,560 | $18,280 | $70,280 |
| 2017 | $1,382 | $67,320 | $17,320 | $50,000 |
| 2016 | $1,380 | $67,320 | $17,320 | $50,000 |
| 2015 | $1,740 | $67,320 | $17,320 | $50,000 |
| 2014 | $1,072 | $55,880 | $11,920 | $43,960 |
Source: Public Records
Map
Nearby Homes
- 225 Winterberry Ct
- 230 Winterberry Ct
- 406 Teal Ct
- 311 Quail Run
- 309 Quail Run
- 227 Quail Run
- 315 Sea Holly Cir
- 324 Teal Ct
- 263 Quail Run
- 150 N Pond Ct Unit 1
- 125 N Pond Way
- 2240 Six Branches Dr
- 420 Little Pines Ct
- 230 Lakeview Ridge E
- 130 Lakeview Ridge W
- 1050 Terramont Dr
- 9470 Hillside Dr
- 680 Branch Valley Ct
- 1985 Branch Valley Dr
- 1820 Branch Valley Dr
- 235 Truehedge Trace
- 155 Winterberry Ct
- 145 Winterberry Ct Unit 1
- 220 Truehedge Trace Unit 2
- 295 Softwood Cir
- 165 Winterberry Ct Unit 1
- 245 Truehedge Trace
- 230 Truehedge Trace
- 210 Truehedge Trace
- 135 Winterberry Ct
- 285 Softwood Cir
- 250 Truehedge Trace Unit 1
- 200 Truehedge Trace
- 105 Sea Holly Cir
- 125 Winterberry Ct Unit 1
- 115 Sun Moss Ct
- 175 Winterberry Ct
- 140 Floss Flower Ct
- 115 Sea Holly Cir
- 105 Sun Moss Ct