Estimated Value: $416,000 - $459,000
--
Bed
--
Bath
1,152
Sq Ft
$377/Sq Ft
Est. Value
About This Home
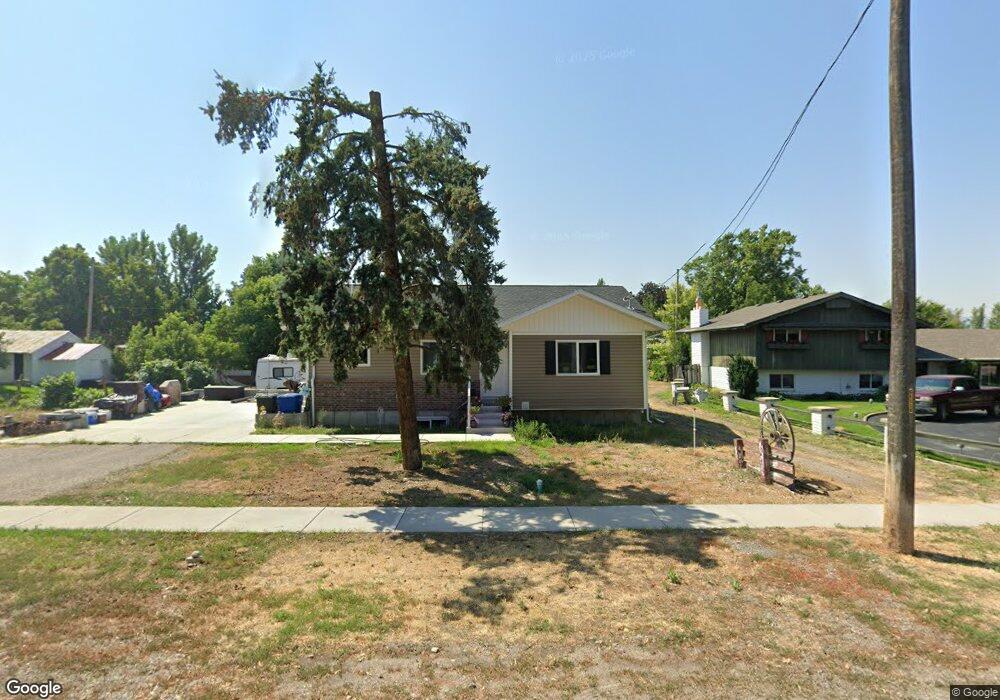
This home is located at 225 W 300 N Unit 2, Hyrum, UT 84319 and is currently estimated at $434,621, approximately $377 per square foot. 225 W 300 N Unit 2 is a home located in Cache County with nearby schools including Lincoln School, South Cache Middle School, and Mountain Crest High School.
Ownership History
Date
Name
Owned For
Owner Type
Purchase Details
Closed on
Apr 30, 2021
Sold by
Willets Jed F
Bought by
Giles Robert Rex
Current Estimated Value
Home Financials for this Owner
Home Financials are based on the most recent Mortgage that was taken out on this home.
Original Mortgage
$142,958
Outstanding Balance
$106,592
Interest Rate
3%
Mortgage Type
FHA
Estimated Equity
$328,029
Purchase Details
Closed on
Apr 29, 2021
Sold by
Giles Robert Rex
Bought by
Giles Robert Rex and Giles Pamela M
Home Financials for this Owner
Home Financials are based on the most recent Mortgage that was taken out on this home.
Original Mortgage
$142,958
Outstanding Balance
$106,592
Interest Rate
3%
Mortgage Type
FHA
Estimated Equity
$328,029
Purchase Details
Closed on
Aug 19, 2020
Sold by
Smith Cory T and Smith Amy
Bought by
Willets Jed F
Purchase Details
Closed on
Jul 25, 2008
Sold by
Francis John Carlos and Francis Annette
Bought by
Smith Cory T and Smith Amy
Create a Home Valuation Report for This Property
The Home Valuation Report is an in-depth analysis detailing your home's value as well as a comparison with similar homes in the area
Home Values in the Area
Average Home Value in this Area
Purchase History
| Date | Buyer | Sale Price | Title Company |
|---|---|---|---|
| Giles Robert Rex | -- | Advanced Title Ins Agcy Lc | |
| Giles Robert Rex | -- | American Secure Title Logan | |
| Willets Jed F | -- | Advanced Title Ins Agcy | |
| Smith Cory T | -- | Advanced Title |
Source: Public Records
Mortgage History
| Date | Status | Borrower | Loan Amount |
|---|---|---|---|
| Open | Giles Robert Rex | $142,958 |
Source: Public Records
Tax History Compared to Growth
Tax History
| Year | Tax Paid | Tax Assessment Tax Assessment Total Assessment is a certain percentage of the fair market value that is determined by local assessors to be the total taxable value of land and additions on the property. | Land | Improvement |
|---|---|---|---|---|
| 2025 | $1,432 | $205,620 | $0 | $0 |
| 2024 | $1,536 | $205,955 | $0 | $0 |
| 2023 | $1,618 | $207,435 | $0 | $0 |
| 2022 | $1,689 | $207,435 | $0 | $0 |
| 2021 | $1,727 | $326,850 | $65,050 | $261,800 |
| 2020 | $1,028 | $182,650 | $65,050 | $117,600 |
| 2019 | $435 | $39,985 | $38,000 | $1,985 |
| 2018 | $448 | $39,805 | $38,000 | $1,805 |
| 2017 | $475 | $39,805 | $0 | $0 |
| 2016 | $486 | $39,805 | $0 | $0 |
| 2015 | $487 | $39,805 | $0 | $0 |
| 2014 | $473 | $39,505 | $0 | $0 |
| 2013 | $439 | $39,505 | $0 | $0 |
Source: Public Records
Map
Nearby Homes