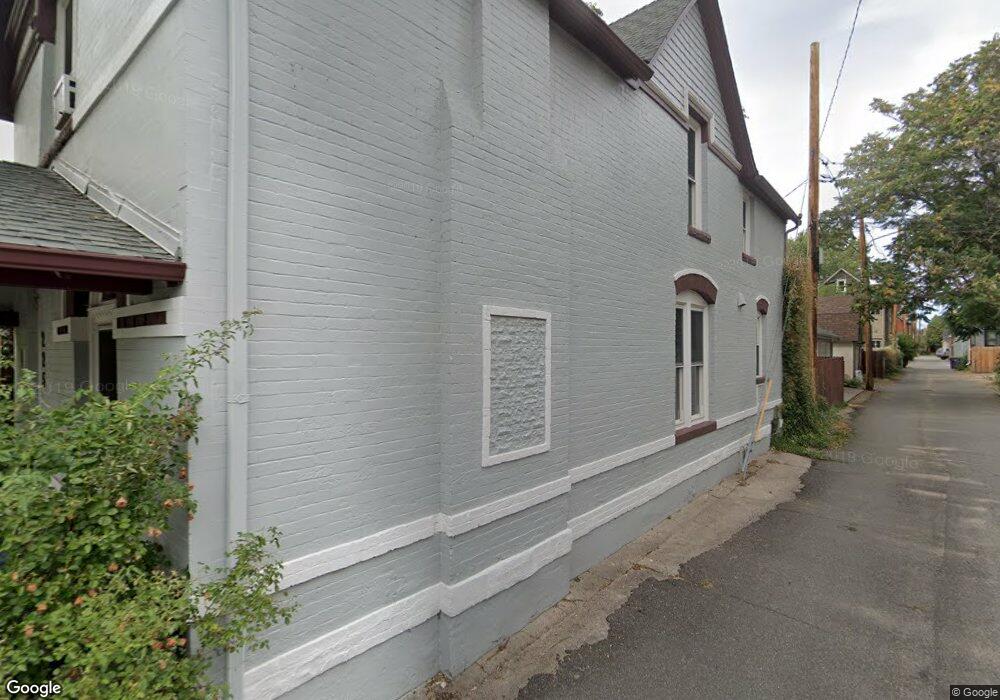
225 W Ellsworth Ave Denver, CO 80223
Baker NeighborhoodEstimated Value: $714,000 - $795,000
3
Beds
2
Baths
1,900
Sq Ft
$401/Sq Ft
Est. Value
About This Home
This home is located at 225 W Ellsworth Ave, Denver, CO 80223 and is currently estimated at $761,266, approximately $400 per square foot. 225 W Ellsworth Ave is a home located in Denver County with nearby schools including Kepner Beacon Middle School, West High School, and Denver School of Science and Technology: Byers Middle School.
Ownership History
Date
Name
Owned For
Owner Type
Purchase Details
Closed on
Mar 24, 2004
Sold by
Stametz Lee and Bryn Carol
Bought by
Kovac James
Current Estimated Value
Home Financials for this Owner
Home Financials are based on the most recent Mortgage that was taken out on this home.
Original Mortgage
$221,800
Outstanding Balance
$103,078
Interest Rate
5.59%
Mortgage Type
Purchase Money Mortgage
Estimated Equity
$658,188
Purchase Details
Closed on
Jul 31, 2000
Sold by
Bryn Carol
Bought by
Stometz Lee and Bryn Carol
Purchase Details
Closed on
Oct 20, 1999
Sold by
Lee Stametz
Bought by
Bryn Carol
Purchase Details
Closed on
Aug 1, 1995
Sold by
Johnson Wendell A
Bought by
Stametz Lee
Home Financials for this Owner
Home Financials are based on the most recent Mortgage that was taken out on this home.
Original Mortgage
$73,507
Interest Rate
7.51%
Create a Home Valuation Report for This Property
The Home Valuation Report is an in-depth analysis detailing your home's value as well as a comparison with similar homes in the area
Home Values in the Area
Average Home Value in this Area
Purchase History
| Date | Buyer | Sale Price | Title Company |
|---|---|---|---|
| Kovac James | $277,300 | Guardian Title Agency Llc | |
| Stometz Lee | -- | -- | |
| Bryn Carol | -- | -- | |
| Stametz Lee | $104,000 | Land Title |
Source: Public Records
Mortgage History
| Date | Status | Borrower | Loan Amount |
|---|---|---|---|
| Open | Kovac James | $221,800 | |
| Previous Owner | Stametz Lee | $73,507 |
Source: Public Records
Tax History Compared to Growth
Tax History
| Year | Tax Paid | Tax Assessment Tax Assessment Total Assessment is a certain percentage of the fair market value that is determined by local assessors to be the total taxable value of land and additions on the property. | Land | Improvement |
|---|---|---|---|---|
| 2024 | $3,522 | $44,470 | $12,710 | $31,760 |
| 2023 | $3,446 | $44,470 | $12,710 | $31,760 |
| 2022 | $3,275 | $41,180 | $17,010 | $24,170 |
| 2021 | $3,161 | $42,360 | $17,500 | $24,860 |
| 2020 | $2,949 | $39,740 | $11,480 | $28,260 |
| 2019 | $2,866 | $39,740 | $11,480 | $28,260 |
| 2018 | $2,640 | $34,120 | $8,810 | $25,310 |
| 2017 | $2,632 | $34,120 | $8,810 | $25,310 |
| 2016 | $2,885 | $35,380 | $2,675 | $32,705 |
| 2015 | $2,473 | $31,650 | $2,675 | $28,975 |
| 2014 | $2,033 | $24,480 | $5,986 | $18,494 |
Source: Public Records
Map
Nearby Homes
- 7 Elati St
- 160 W Bayaud Ave
- 120 W Bayaud Ave
- 11 W Ellsworth Ave Unit 22
- 30 Fox St
- 145 S Cherokee St
- 172 W Maple Ave
- 48 Galapago St
- 165 S Bannock St
- 256 Bannock St
- 274 Delaware St
- 45 Galapago St
- 47 W Cedar Ave
- 44 N Lincoln St
- 76 Lincoln St
- 95 W Byers Place
- 277 N Broadway Unit 301
- 277 N Broadway Unit 401
- 277 N Broadway Unit 403
- 277 N Broadway Unit 206
- 235 W Ellsworth Ave
- 239 W Ellsworth Ave
- 245 W Ellsworth Ave
- 35 Bannock St
- 9 Bannock St
- 15 Bannock St Unit 17
- 19 Bannock St
- 222 W Ellsworth Ave
- 5 Bannock St
- 218 W Ellsworth Ave
- 25 Bannock St
- 214 W Ellsworth Ave
- 236 W Irvington Place
- 240 W Irvington Place
- 230-282 W Ellsworth Ave
- 290 W Ellsworth Ave
- 212 W Ellsworth Ave
- 224 W Irvington Place
- 218 W Irvington Place
- 244 W Irvington Place