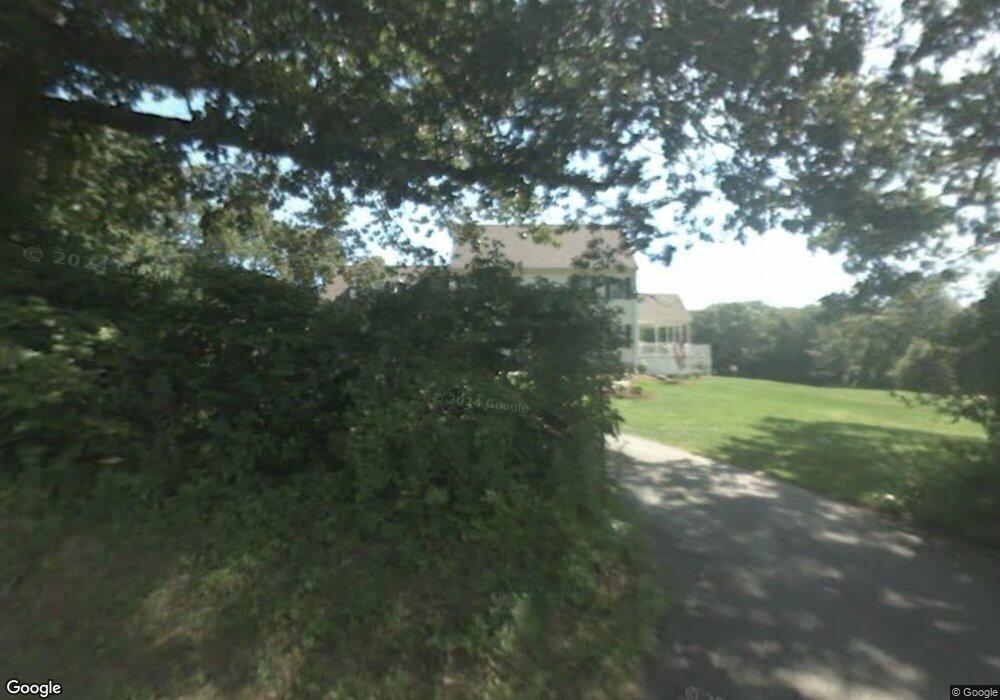
225 West Rd Colchester, CT 06415
Estimated Value: $602,079 - $685,000
4
Beds
3
Baths
3,146
Sq Ft
$199/Sq Ft
Est. Value
About This Home
This home is located at 225 West Rd, Colchester, CT 06415 and is currently estimated at $626,270, approximately $199 per square foot. 225 West Rd is a home located in New London County with nearby schools including Colchester Elementary School, Jack Jackter Intermediate School, and William J. Johnston Middle School.
Ownership History
Date
Name
Owned For
Owner Type
Purchase Details
Closed on
Feb 22, 2019
Sold by
Graff Steve
Bought by
Steve Graff Lt
Current Estimated Value
Purchase Details
Closed on
Jul 26, 2001
Sold by
Miazga Carl and Miazga Anita
Bought by
Graff Steve and Graff Bonnie
Home Financials for this Owner
Home Financials are based on the most recent Mortgage that was taken out on this home.
Original Mortgage
$25,000
Interest Rate
7.18%
Mortgage Type
Purchase Money Mortgage
Create a Home Valuation Report for This Property
The Home Valuation Report is an in-depth analysis detailing your home's value as well as a comparison with similar homes in the area
Home Values in the Area
Average Home Value in this Area
Purchase History
| Date | Buyer | Sale Price | Title Company |
|---|---|---|---|
| Steve Graff Lt | -- | -- | |
| Graff Steve | -- | -- | |
| Graff Steve | $58,000 | -- | |
| Miazga Carl | $45,000 | -- |
Source: Public Records
Mortgage History
| Date | Status | Borrower | Loan Amount |
|---|---|---|---|
| Previous Owner | Miazga Carl | $143,250 | |
| Previous Owner | Miazga Carl | $280,000 | |
| Previous Owner | Miazga Carl | $196,000 | |
| Previous Owner | Miazga Carl | $25,000 |
Source: Public Records
Tax History Compared to Growth
Tax History
| Year | Tax Paid | Tax Assessment Tax Assessment Total Assessment is a certain percentage of the fair market value that is determined by local assessors to be the total taxable value of land and additions on the property. | Land | Improvement |
|---|---|---|---|---|
| 2025 | $9,000 | $300,800 | $40,600 | $260,200 |
| 2024 | $8,624 | $300,800 | $40,600 | $260,200 |
| 2023 | $8,188 | $300,800 | $40,600 | $260,200 |
| 2022 | $8,146 | $300,800 | $40,600 | $260,200 |
| 2021 | $8,039 | $244,800 | $42,700 | $202,100 |
| 2020 | $8,039 | $244,800 | $42,700 | $202,100 |
| 2019 | $8,039 | $244,800 | $42,700 | $202,100 |
| 2018 | $7,902 | $244,800 | $42,700 | $202,100 |
| 2017 | $7,924 | $244,800 | $42,700 | $202,100 |
| 2016 | $7,588 | $245,500 | $54,900 | $190,600 |
| 2015 | $7,552 | $245,500 | $54,900 | $190,600 |
| 2014 | $7,505 | $245,500 | $54,900 | $190,600 |
Source: Public Records
Map
Nearby Homes
- 376 West Rd
- 39 Briarwood Dr
- 10 West Rd
- 90 Lake Shore Dr
- 79 Mill Lane Rd
- 99 Lake Hayward Rd
- 73 Lake Shore Dr
- 65 McDonald Rd
- 608 West Rd
- Lot #2 Taylor Rd
- 63 Taylor Rd
- 129 Salem Rd
- 17 Harvest Ln
- 3 Westerly Terrace
- 216 Elliot Dr
- 19 Esther Ln
- 251 Westerly Terrace
- 16 Doctor Foote Rd
- 59 Kramer Rd
- 9 Taylor Rd