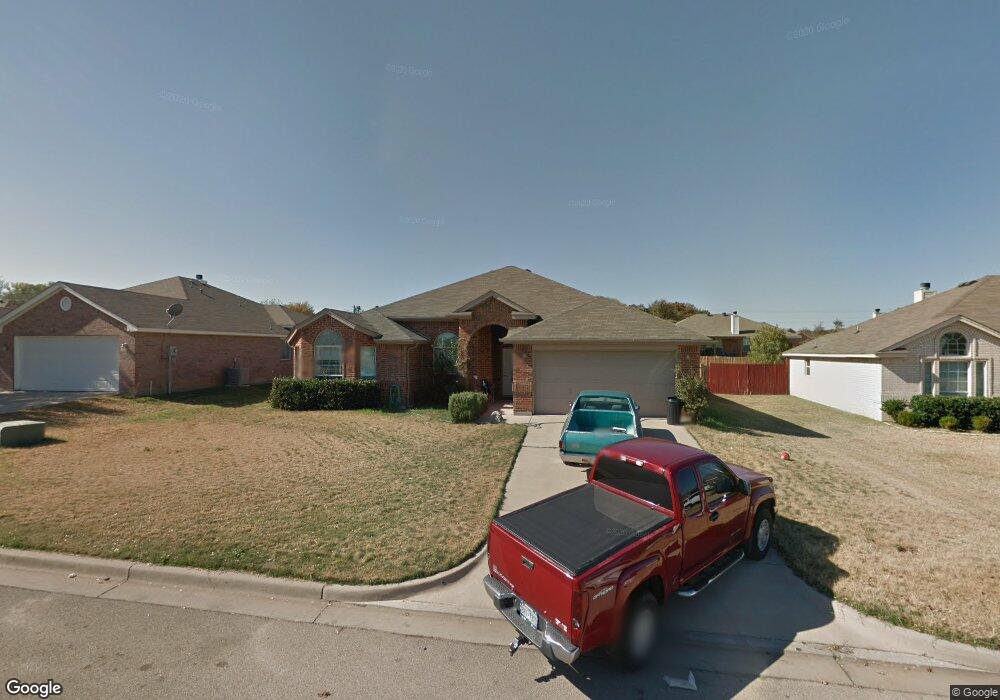
225 Whitestone Way Weatherford, TX 76085
Estimated Value: $323,363 - $356,000
4
Beds
2
Baths
1,960
Sq Ft
$174/Sq Ft
Est. Value
About This Home
This home is located at 225 Whitestone Way, Weatherford, TX 76085 and is currently estimated at $340,591, approximately $173 per square foot. 225 Whitestone Way is a home located in Parker County with nearby schools including Crockett Elementary School, Tison Middle School, and Weatherford High School.
Ownership History
Date
Name
Owned For
Owner Type
Purchase Details
Closed on
Dec 12, 2019
Sold by
Rowe Heath
Bought by
Reed Vickl Ann
Current Estimated Value
Purchase Details
Closed on
Aug 4, 2008
Sold by
Rowe Larry F and Rowe Kay G
Bought by
Rowe Heath
Purchase Details
Closed on
Apr 23, 2008
Sold by
Smith Tk and 225 Whitstone Land Trust
Bought by
Rowe Larry F and Rowe Kay G
Purchase Details
Closed on
Oct 29, 2007
Sold by
Faulkner Jeffrey R and Faulkner Kristy M
Bought by
Smith Tk and Faulkner 225 Whitstone Land Trust
Purchase Details
Closed on
Aug 29, 2005
Sold by
Daniel Kristian C and Daniel Mikki K
Bought by
Faulkner Jeffrey Robert
Home Financials for this Owner
Home Financials are based on the most recent Mortgage that was taken out on this home.
Original Mortgage
$133,200
Interest Rate
7.62%
Mortgage Type
Adjustable Rate Mortgage/ARM
Create a Home Valuation Report for This Property
The Home Valuation Report is an in-depth analysis detailing your home's value as well as a comparison with similar homes in the area
Home Values in the Area
Average Home Value in this Area
Purchase History
| Date | Buyer | Sale Price | Title Company |
|---|---|---|---|
| Reed Vickl Ann | -- | Stewart | |
| Rowe Heath | -- | None Available | |
| Rowe Larry F | -- | None Available | |
| Smith Tk | -- | None Available | |
| Faulkner Jeffrey Robert | -- | None Available |
Source: Public Records
Mortgage History
| Date | Status | Borrower | Loan Amount |
|---|---|---|---|
| Previous Owner | Faulkner Jeffrey Robert | $133,200 |
Source: Public Records
Tax History Compared to Growth
Tax History
| Year | Tax Paid | Tax Assessment Tax Assessment Total Assessment is a certain percentage of the fair market value that is determined by local assessors to be the total taxable value of land and additions on the property. | Land | Improvement |
|---|---|---|---|---|
| 2025 | $6,536 | $326,430 | $50,000 | $276,430 |
| 2024 | $6,536 | $339,100 | $40,000 | $299,100 |
| 2023 | $6,536 | $339,100 | $40,000 | $299,100 |
| 2022 | $5,096 | $229,720 | $30,000 | $199,720 |
| 2021 | $5,517 | $229,720 | $30,000 | $199,720 |
| 2020 | $5,156 | $213,390 | $30,000 | $183,390 |
| 2019 | $5,449 | $213,390 | $30,000 | $183,390 |
| 2018 | $4,553 | $177,510 | $30,000 | $147,510 |
| 2017 | $4,306 | $177,510 | $30,000 | $147,510 |
| 2016 | $3,914 | $148,770 | $20,000 | $128,770 |
| 2015 | $3,464 | $148,770 | $20,000 | $128,770 |
| 2014 | -- | $136,580 | $20,000 | $116,580 |
Source: Public Records
Map
Nearby Homes
- 1917 Windowmere Trail
- 214 Willow Creek Dr
- 2045 Mason Pond Dr
- 2113-A Dicey Rd
- Horseshoe Bend Rd
- 0 Adell Cir
- 1609 Dicey Rd
- 309 De la Cruz St
- 313 De la Cruz St
- 509 Sweetwater Dr
- 522 Crow Ave
- 2122 Louis Tr
- 905 Terry Trail
- 2217 Lorrie Ln
- 107 Hickory Ln
- 513 Waterford Park Blvd
- 517 Waterford Park Blvd
- 521 Waterford Park Blvd
- 516 Waterford Park Blvd
- 520 Waterford Park Blvd
- 221 Whitestone Way
- 229 Whitestone Way
- 226 Wellington Trail
- 230 Wellington Trail
- 217 Whitestone Way
- 233 Whitestone Way
- 233 Whitestone Way
- 226 Whitestone Way
- 222 Whitestone Way
- 234 Wellington Trail
- 218 Wellington Trail
- 230 Whitestone Way
- 218 Whitestone Way
- 213 Whitestone Way
- 237 Whitestone Way
- 238 Wellington Trail
- 214 Wellington Trail
- 234 Whitestone Way
- 214 Whitestone Way
- 209 Whitestone Way