2250 Cauble Rd Salisbury, NC 28144
Estimated Value: $405,000 - $785,000
4
Beds
4
Baths
2,918
Sq Ft
$183/Sq Ft
Est. Value
About This Home
This home is located at 2250 Cauble Rd, Salisbury, NC 28144 and is currently estimated at $534,396, approximately $183 per square foot. 2250 Cauble Rd is a home located in Rowan County with nearby schools including North Rowan Elementary School, North Rowan Middle School, and North Rowan High School.
Create a Home Valuation Report for This Property
The Home Valuation Report is an in-depth analysis detailing your home's value as well as a comparison with similar homes in the area
Tax History
| Year | Tax Paid | Tax Assessment Tax Assessment Total Assessment is a certain percentage of the fair market value that is determined by local assessors to be the total taxable value of land and additions on the property. | Land | Improvement |
|---|---|---|---|---|
| 2025 | $2,649 | $395,413 | $56,312 | $339,101 |
| 2024 | $2,649 | $395,413 | $56,312 | $339,101 |
| 2023 | $1,357 | $202,600 | $56,312 | $146,288 |
| 2022 | $1,092 | $146,143 | $47,185 | $98,958 |
| 2021 | $1,066 | $146,143 | $47,185 | $98,958 |
| 2020 | $1,066 | $146,143 | $47,185 | $98,958 |
| 2019 | $1,066 | $146,143 | $47,185 | $98,958 |
| 2018 | $985 | $136,183 | $47,184 | $88,999 |
| 2017 | $985 | $136,183 | $47,184 | $88,999 |
| 2016 | $985 | $136,183 | $47,184 | $88,999 |
| 2015 | $1,000 | $136,183 | $47,184 | $88,999 |
| 2014 | $1,014 | $140,854 | $47,184 | $93,670 |
Source: Public Records
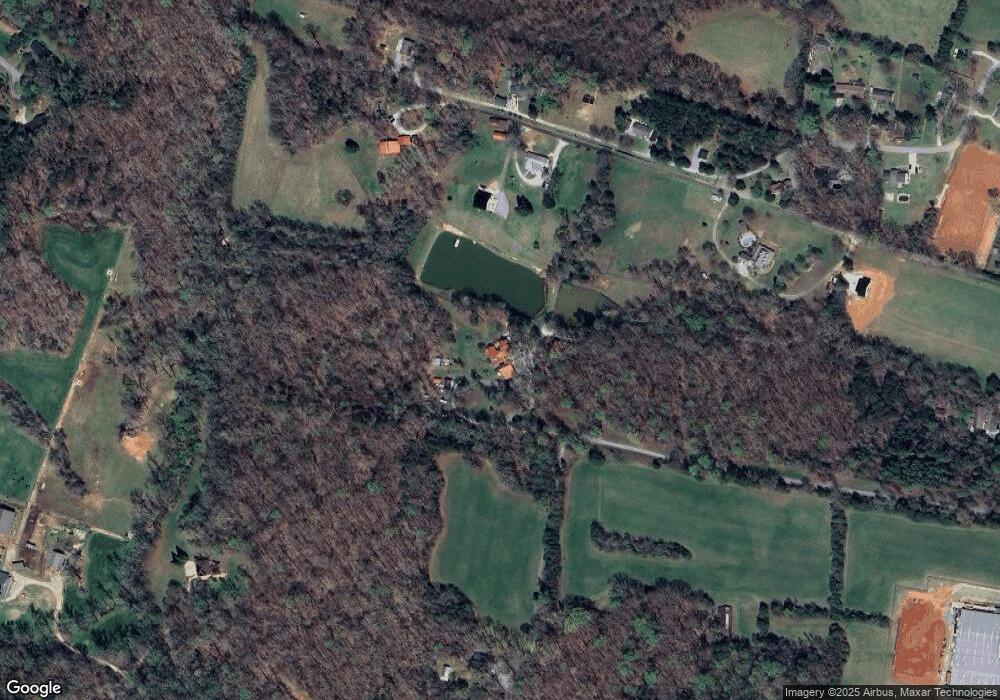
Map
Nearby Homes
- 430 Old Wood Ln
- 605 Bonanza Dr
- 450 E Ridge Rd
- 140 Elizabeth Ave
- 250 Douglas St
- 1750 Sells Rd
- 4355 Franklin Community Center Rd
- 350 Pinevale Dr
- 165 Franklin Church Dr
- 5635 U S 601
- 255 Lariat Cir
- 235 Lariat Cir
- 270 North St
- 470 Nestlewood Ln
- 240 Eldon Ln
- 7511 Old Mocksville Rd
- 0 Long Bow Rd Unit 1200498
- 3230 W Innes St
- 307 Pantego Place
- 1410 Amberlight Cir
- 370 Down Yonder Dr
- 480 Down Yonder Dr
- 285 Elwood Ln
- 255 Elwood Ln
- 250 Down Yonder Dr
- 2240 Cauble Rd
- 301 Elwood Ln
- 220 Elwood Ln
- 160 Elwood Ln
- 295 Fading D Farm Rd
- 175 Elwood Ln
- 140 Elwood Ln
- 115 Elwood Ln
- 00 Todd St
- 2270 Cauble Rd
- 0 Todd St
- 115 Todd St
- 115 Todd St Unit 14,15,16
- 665 Bonanza Dr
- 2050 Cauble Rd
Your Personal Tour Guide
Ask me questions while you tour the home.