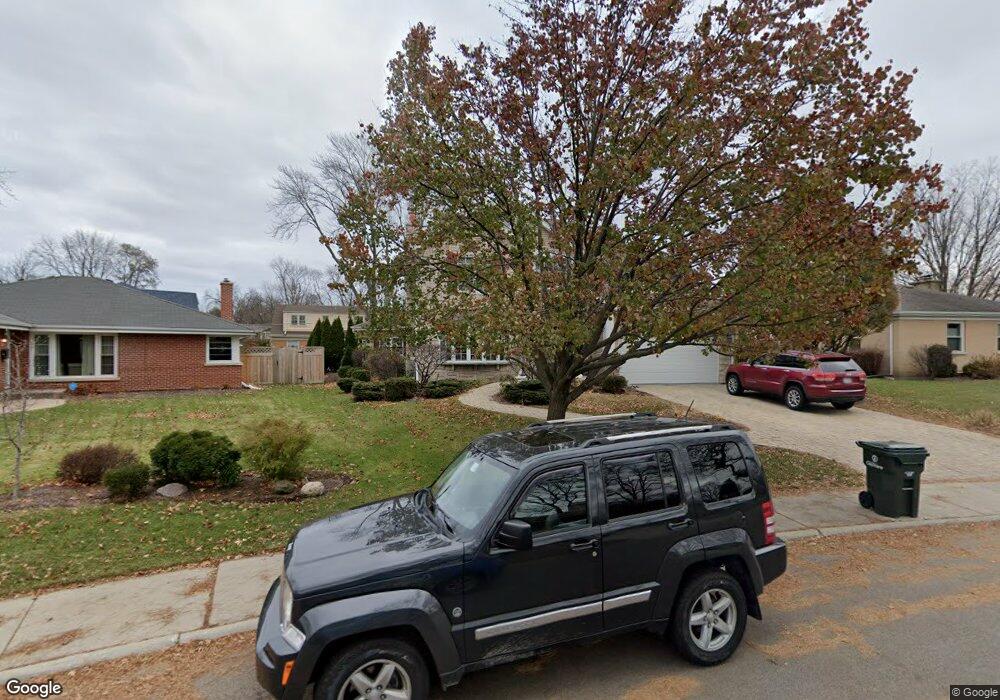
2250 Robincrest Ln Glenview, IL 60025
Estimated Value: $1,028,213 - $1,737,000
5
Beds
4
Baths
3,534
Sq Ft
$391/Sq Ft
Est. Value
About This Home
This home is located at 2250 Robincrest Ln, Glenview, IL 60025 and is currently estimated at $1,380,803, approximately $390 per square foot. 2250 Robincrest Ln is a home located in Cook County with nearby schools including Hoffman Elementary School, Henking Elementary School, and Springman Middle School.
Ownership History
Date
Name
Owned For
Owner Type
Purchase Details
Closed on
Dec 28, 2015
Sold by
Betsoleiman Fred and Betsoleiman Sandra
Bought by
Betsoleiman Sandra J and Sandra J Betsoleiman Trust Agreement
Current Estimated Value
Purchase Details
Closed on
Aug 2, 1995
Sold by
Chapman David and Chapman Laurie W
Bought by
Betsoleiman Fred and Betsoleiman Sandra
Home Financials for this Owner
Home Financials are based on the most recent Mortgage that was taken out on this home.
Original Mortgage
$170,000
Interest Rate
7.55%
Create a Home Valuation Report for This Property
The Home Valuation Report is an in-depth analysis detailing your home's value as well as a comparison with similar homes in the area
Home Values in the Area
Average Home Value in this Area
Purchase History
| Date | Buyer | Sale Price | Title Company |
|---|---|---|---|
| Betsoleiman Sandra J | -- | Attorney | |
| Betsoleiman Fred | $225,000 | -- |
Source: Public Records
Mortgage History
| Date | Status | Borrower | Loan Amount |
|---|---|---|---|
| Closed | Betsoleiman Fred | $170,000 |
Source: Public Records
Tax History
| Year | Tax Paid | Tax Assessment Tax Assessment Total Assessment is a certain percentage of the fair market value that is determined by local assessors to be the total taxable value of land and additions on the property. | Land | Improvement |
|---|---|---|---|---|
| 2025 | $15,887 | $114,000 | $14,942 | $99,058 |
| 2024 | $15,887 | $67,112 | $12,582 | $54,530 |
| 2023 | $15,439 | $71,777 | $12,582 | $59,195 |
| 2022 | $15,439 | $71,777 | $12,582 | $59,195 |
| 2021 | $14,209 | $57,087 | $9,633 | $47,454 |
| 2020 | $16,717 | $67,971 | $9,633 | $58,338 |
| 2019 | $15,580 | $74,694 | $9,633 | $65,061 |
| 2018 | $15,872 | $69,011 | $8,453 | $60,558 |
| 2017 | $15,449 | $69,011 | $8,453 | $60,558 |
| 2016 | $14,598 | $69,011 | $8,453 | $60,558 |
| 2015 | $12,461 | $52,328 | $6,881 | $45,447 |
| 2014 | $12,233 | $52,328 | $6,881 | $45,447 |
| 2013 | $12,373 | $54,590 | $6,881 | $47,709 |
Source: Public Records
Map
Nearby Homes
- 625 Wissing Ln
- 517 Briarhill Ln
- 440 Briarhill Rd
- 2009 Robincrest Ln
- 2537 Pick Dr
- 2238 Prairie St
- 1088 Shermer Rd Unit DW
- 2700 Fontana Dr
- 1777 Dewes St Unit E
- 1800 Dewes St Unit 310
- 216 Flora Ave
- 1853 Prairie St Unit A4
- 245 Nora Ave
- 706 Waukegan Rd Unit 4
- 1730 George Ct
- 311 Neva Ave
- 2506 Allison Ct
- 124 Harlem Ave
- 1220 Depot St Unit 305
- 38 Washington St
- 2240 Robincrest Ln
- 2252 Robincrest Ln
- 2228 Robincrest Ln
- 2230 Robincrest Ln
- 2300 Robincrest Ln
- 2301 Robincrest Ln
- 2226 Robincrest Ln Unit 6
- 2302 Robincrest Ln
- 2245 Robincrest Ln
- 2224 Robincrest Ln Unit 6
- 2239 Robincrest Ln
- 2251 Robincrest Ln
- 2308 Robincrest Ln
- 2233 Robincrest Ln
- 2303 Robincrest Ln
- 2233 Larkdale Dr
- 2227 Larkdale Dr Unit 1
- 2315 Robincrest Ln
- 2220 Robincrest Ln
- 2223 Robincrest Ln
Your Personal Tour Guide
Ask me questions while you tour the home.