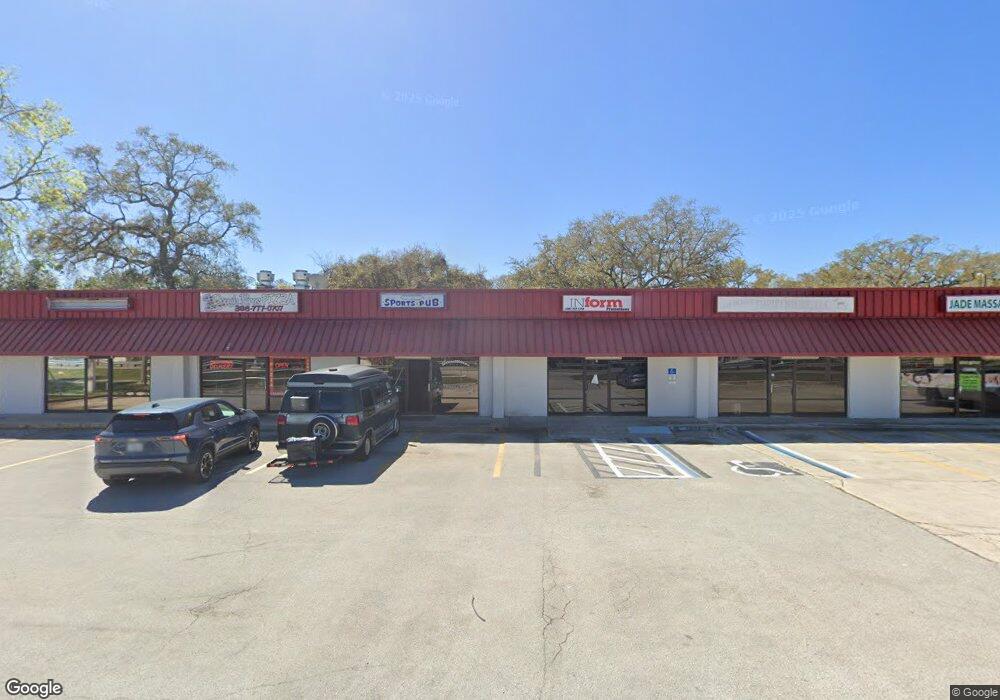
2250 S Nova Rd South Daytona, FL 32119
Estimated Value: $787,336
--
Bed
12
Baths
11,285
Sq Ft
$70/Sq Ft
Est. Value
About This Home
This home is located at 2250 S Nova Rd, South Daytona, FL 32119 and is currently estimated at $787,336, approximately $69 per square foot. 2250 S Nova Rd is a home located in Volusia County with nearby schools including Atlantic High School, South Daytona Elementary School, and Silver Sands Middle School.
Ownership History
Date
Name
Owned For
Owner Type
Purchase Details
Closed on
Apr 1, 2018
Sold by
Walker Donald R and Walker Charlene S
Bought by
Purucker Properties Llc
Current Estimated Value
Home Financials for this Owner
Home Financials are based on the most recent Mortgage that was taken out on this home.
Original Mortgage
$479,000
Interest Rate
4.43%
Mortgage Type
Commercial
Purchase Details
Closed on
Sep 1, 2016
Sold by
Padgett Ralph L
Bought by
Walker Donalkd R and Walker Cahrlene S
Purchase Details
Closed on
Jan 15, 2013
Sold by
Beckman Nancy B
Bought by
Padgett Ralph L
Purchase Details
Closed on
May 2, 2001
Sold by
Beckman Nancy B
Bought by
Beckman Nancy B
Purchase Details
Closed on
Jan 15, 1988
Bought by
Padgett Ralph L
Purchase Details
Closed on
Jun 15, 1987
Bought by
Padgett Ralph L
Create a Home Valuation Report for This Property
The Home Valuation Report is an in-depth analysis detailing your home's value as well as a comparison with similar homes in the area
Home Values in the Area
Average Home Value in this Area
Purchase History
| Date | Buyer | Sale Price | Title Company |
|---|---|---|---|
| Purucker Properties Llc | $480,000 | Attorney | |
| Walker Donalkd R | $300,000 | None Available | |
| Padgett Ralph L | $350,000 | Attorney | |
| Beckman Nancy B | -- | -- | |
| Padgett Ralph L | $100 | -- | |
| Padgett Ralph L | $100 | -- |
Source: Public Records
Mortgage History
| Date | Status | Borrower | Loan Amount |
|---|---|---|---|
| Closed | Purucker Properties Llc | $479,000 |
Source: Public Records
Tax History Compared to Growth
Tax History
| Year | Tax Paid | Tax Assessment Tax Assessment Total Assessment is a certain percentage of the fair market value that is determined by local assessors to be the total taxable value of land and additions on the property. | Land | Improvement |
|---|---|---|---|---|
| 2025 | $8,862 | $453,291 | $285,870 | $167,421 |
| 2024 | $8,862 | $455,870 | $285,870 | $170,000 |
| 2023 | $8,862 | $441,508 | $285,870 | $155,638 |
| 2022 | $8,628 | $425,266 | $285,870 | $139,396 |
| 2021 | $8,818 | $413,669 | $285,870 | $127,799 |
| 2020 | $8,887 | $416,805 | $285,870 | $130,935 |
| 2019 | $8,668 | $407,311 | $285,870 | $121,441 |
| 2018 | $7,500 | $347,190 | $190,580 | $156,610 |
| 2017 | $7,593 | $339,948 | $190,580 | $149,368 |
| 2016 | $7,494 | $330,731 | $0 | $0 |
| 2015 | $7,139 | $304,585 | $0 | $0 |
| 2014 | $6,951 | $294,037 | $0 | $0 |
Source: Public Records
Map
Nearby Homes
- 2300 S Nova Rd Unit 23
- 2300 S Nova Rd Unit 32
- 1018 Green Acres Cir S Unit N
- 0 S Nova Rd
- 918 Lakeview Dr Unit 350
- 918 Reed Canal Rd Unit Lot 270
- 918 Reed Canal Rd Unit 186
- 918 Reed Canal Rd Unit Lot 417
- 918 Reed Canal Rd Unit 234
- 918 Reed Canal Rd
- 918 Reed Canal Rd Unit 144
- 918 Reed Canal Rd Unit 266
- 918 Reed Canal Rd Unit 428
- 918 Reed Canal Rd Unit Lot 171
- 918 Reed Canal Rd Unit Lot 104
- 918 Reed Canal Rd Unit 267
- 918 Reed Canal Rd Unit 408
- 918 Reed Canal Rd Unit 346
- 918 Reed Canal Rd Unit 202
- 918 Reed Canal Rd Unit 434
- 1019 Beckman Dr
- 1023 Beckman Dr
- 1034 Beckman Dr
- 1038 Beckman Dr
- 1017 Green Acres Cir S
- 1025 Green Acres Cir S
- 1042 Beckman Dr
- 2150 S Nova Rd Unit 2plus
- 2150 S Nova Rd
- 1029 Green Acres Cir S
- 1046 Beckman Dr
- 2330 S Nova Rd Unit B
- 2330 S Nova Rd Unit 4
- 1024 Green Acres Cir S
- 1028 Green Acres Cir S
- 2300 S Nova Rd Unit 16
- 2300 S Nova Rd Unit 29
- 2300 S Nova Rd Unit 18
- 2300 S Nova Rd Unit 19
- 2300 S Nova Rd Unit 22