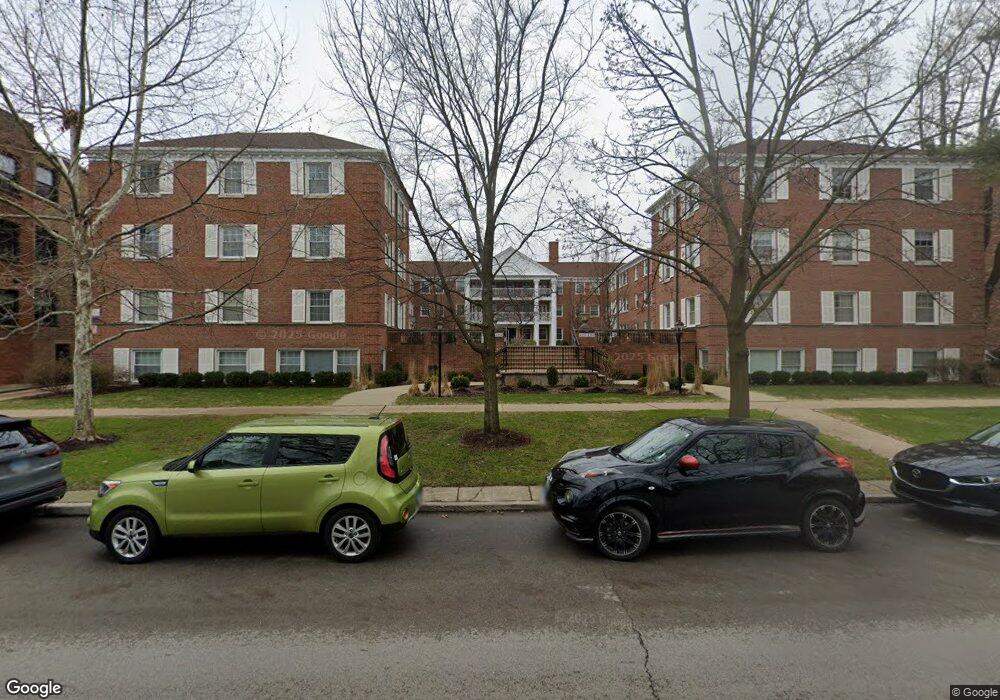
2250 Sherman Ave Unit 22501 Evanston, IL 60201
Northeast Evanston NeighborhoodEstimated Value: $236,000 - $243,099
2
Beds
--
Bath
950
Sq Ft
$252/Sq Ft
Est. Value
About This Home
This home is located at 2250 Sherman Ave Unit 22501, Evanston, IL 60201 and is currently estimated at $239,025, approximately $251 per square foot. 2250 Sherman Ave Unit 22501 is a home located in Cook County with nearby schools including Orrington Elementary School, Haven Middle School, and Evanston Township High School.
Ownership History
Date
Name
Owned For
Owner Type
Purchase Details
Closed on
Feb 28, 2022
Sold by
Hu Kejia
Bought by
Hunter Denise
Current Estimated Value
Purchase Details
Closed on
Feb 5, 2022
Sold by
Hu Kejia
Bought by
Hunter Denise
Purchase Details
Closed on
Aug 28, 2013
Sold by
Johnson Jacqueline Z
Bought by
Hu Kejia
Purchase Details
Closed on
Mar 16, 2009
Sold by
Johnson Jacqueline Z
Bought by
Johnson Jacqueline Z and Jacqueline Z Johnson Revocable Trust
Purchase Details
Closed on
Jan 26, 2004
Sold by
Heyden William F Vander and Koenigs Charles P
Bought by
Johnson Charles J and Johnson Jacqueline Z
Purchase Details
Closed on
Aug 12, 1997
Sold by
Zimmerman Charles J and Zimmerman Steven B
Bought by
Vanderheyden William F and Koenigs Charles P
Home Financials for this Owner
Home Financials are based on the most recent Mortgage that was taken out on this home.
Original Mortgage
$95,000
Interest Rate
7.54%
Purchase Details
Closed on
Jun 10, 1996
Sold by
Zimmerman Marian B
Bought by
Zimmerman Marian B
Create a Home Valuation Report for This Property
The Home Valuation Report is an in-depth analysis detailing your home's value as well as a comparison with similar homes in the area
Home Values in the Area
Average Home Value in this Area
Purchase History
| Date | Buyer | Sale Price | Title Company |
|---|---|---|---|
| Hunter Denise | $172,000 | -- | |
| Hunter Denise | $172,000 | -- | |
| Hu Kejia | $132,000 | Pntn | |
| Johnson Jacqueline Z | -- | None Available | |
| Johnson Charles J | $235,000 | Multiple | |
| Vanderheyden William F | $6,666 | -- | |
| Zimmerman Marian B | -- | -- |
Source: Public Records
Mortgage History
| Date | Status | Borrower | Loan Amount |
|---|---|---|---|
| Previous Owner | Vanderheyden William F | $95,000 |
Source: Public Records
Tax History Compared to Growth
Tax History
| Year | Tax Paid | Tax Assessment Tax Assessment Total Assessment is a certain percentage of the fair market value that is determined by local assessors to be the total taxable value of land and additions on the property. | Land | Improvement |
|---|---|---|---|---|
| 2024 | $3,709 | $18,500 | $2,366 | $16,134 |
| 2023 | $4,334 | $18,500 | $2,366 | $16,134 |
| 2022 | $4,334 | $18,500 | $2,366 | $16,134 |
| 2021 | $3,998 | $14,930 | $1,561 | $13,369 |
| 2020 | $3,124 | $14,930 | $1,561 | $13,369 |
| 2019 | $3,048 | $16,328 | $1,561 | $14,767 |
| 2018 | $2,241 | $11,547 | $1,324 | $10,223 |
| 2017 | $2,198 | $11,547 | $1,324 | $10,223 |
| 2016 | $2,309 | $11,547 | $1,324 | $10,223 |
| 2015 | $2,428 | $11,599 | $1,135 | $10,464 |
| 2014 | $2,968 | $13,660 | $1,135 | $12,525 |
| 2013 | $4,594 | $17,572 | $1,135 | $16,437 |
Source: Public Records
Map
Nearby Homes
- 734 Noyes St Unit 2
- 734 Noyes St Unit R1
- 2300 Sherman Ave Unit 2C
- 2300 Sherman Ave Unit 2D
- 730 Noyes St Unit K3
- 2252 Orrington Ave
- 2125 Sherman Ave
- 2236 Ridge Ave
- 2353 Ridge Ave
- 2033 Sherman Ave Unit 409
- 2033 Sherman Ave Unit 403
- 2033 Sherman Ave Unit 504
- 2026 Maple Ave
- 2012 Maple Ave
- 736 Central St
- 721 Emerson St Unit 2W
- 1862 Sherman Ave Unit 1NE
- 1864 Sherman Ave Unit 3SW
- 1864 Sherman Ave Unit 5NW
- 1860 Sherman Ave Unit 7NE
- 2246 Sherman Ave Unit 2
- 2242 Sherman Ave Unit 2242G
- 2246 Sherman Ave Unit 22461
- 2246 Sherman Ave Unit 22462
- 2242 Sherman Ave Unit 22423
- 2242 Sherman Ave Unit 22422
- 2250 Sherman Ave Unit 22503
- 2250 Sherman Ave Unit 22502
- 2246 Sherman Ave Unit 22463
- 2242 Sherman Ave Unit 22421
- 2242 Sherman Ave Unit 2
- 2250 Sherman Ave Unit 3
- 2246 Sherman Ave Unit 1
- 2256 Sherman Ave Unit 22562
- 2256 Sherman Ave Unit 22563
- 2256 Sherman Ave Unit 22561
- 2256 Sherman Ave Unit 2
- 2244 Sherman Ave Unit 22441
- 2244 Sherman Ave Unit 22443
- 2244 Sherman Ave Unit 22442