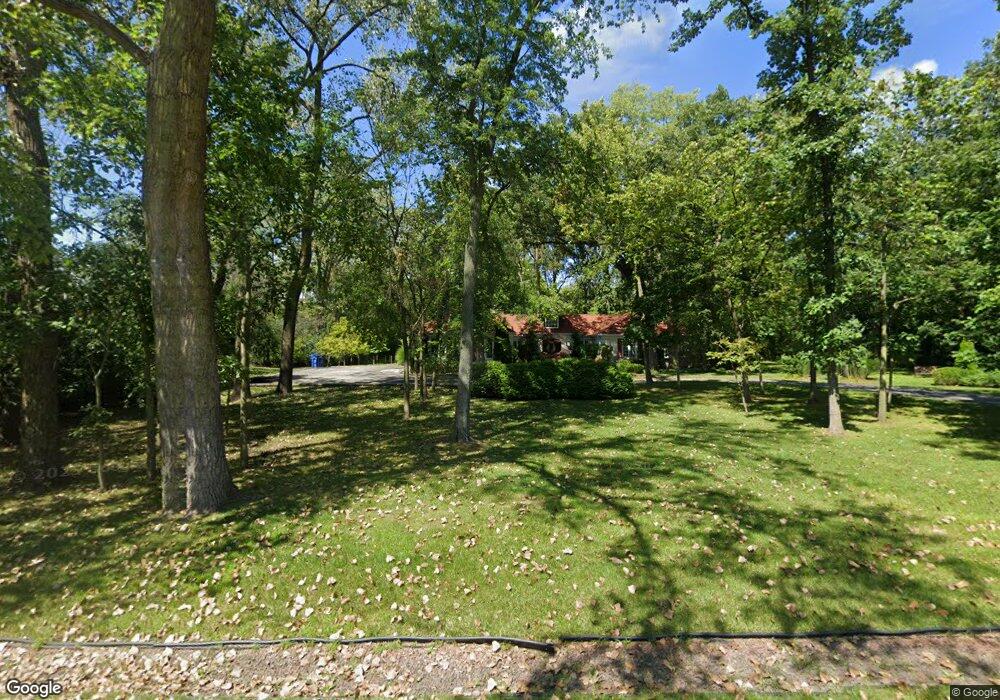
2250 Westcourse Dr Riverwoods, IL 60015
Indian Trail Estates NeighborhoodEstimated Value: $825,000 - $1,359,000
3
Beds
3
Baths
2,648
Sq Ft
$386/Sq Ft
Est. Value
About This Home
This home is located at 2250 Westcourse Dr, Riverwoods, IL 60015 and is currently estimated at $1,020,961, approximately $385 per square foot. 2250 Westcourse Dr is a home located in Lake County with nearby schools including Bannockburn School, Deerfield High School, and Riverwoods Montessori School.
Ownership History
Date
Name
Owned For
Owner Type
Purchase Details
Closed on
Mar 3, 2021
Sold by
Krivorunchko Gennadly
Bought by
Krivorunchko Gennadiy and Krivorunchko Irina
Current Estimated Value
Home Financials for this Owner
Home Financials are based on the most recent Mortgage that was taken out on this home.
Original Mortgage
$548,250
Outstanding Balance
$403,692
Interest Rate
2.37%
Mortgage Type
New Conventional
Estimated Equity
$617,269
Purchase Details
Closed on
Jun 15, 2012
Sold by
Coleman Phillip I and Coleman Helen S
Bought by
Krivoruchko Gennadiy
Home Financials for this Owner
Home Financials are based on the most recent Mortgage that was taken out on this home.
Original Mortgage
$350,000
Interest Rate
3.83%
Mortgage Type
New Conventional
Purchase Details
Closed on
Aug 18, 2004
Sold by
Coleman Philip I and Coleman Helen S
Bought by
Coleman Phillip I and Coleman Helen S
Purchase Details
Closed on
Dec 18, 1995
Sold by
Nbd Bank
Bought by
Coleman Phillip I and Coleman Helen S
Create a Home Valuation Report for This Property
The Home Valuation Report is an in-depth analysis detailing your home's value as well as a comparison with similar homes in the area
Home Values in the Area
Average Home Value in this Area
Purchase History
| Date | Buyer | Sale Price | Title Company |
|---|---|---|---|
| Krivorunchko Gennadiy | -- | First American Title | |
| Krivoruchko Gennadiy | $475,000 | Attorneys Title Guaranty Fun | |
| Coleman Phillip I | -- | -- | |
| Coleman Phillip I | -- | -- |
Source: Public Records
Mortgage History
| Date | Status | Borrower | Loan Amount |
|---|---|---|---|
| Open | Krivorunchko Gennadiy | $548,250 | |
| Closed | Krivoruchko Gennadiy | $350,000 |
Source: Public Records
Tax History Compared to Growth
Tax History
| Year | Tax Paid | Tax Assessment Tax Assessment Total Assessment is a certain percentage of the fair market value that is determined by local assessors to be the total taxable value of land and additions on the property. | Land | Improvement |
|---|---|---|---|---|
| 2024 | $15,207 | $238,559 | $93,558 | $145,001 |
| 2023 | $15,207 | $228,943 | $89,787 | $139,156 |
| 2022 | $14,586 | $212,606 | $94,010 | $118,596 |
| 2021 | $13,803 | $204,980 | $90,638 | $114,342 |
| 2020 | $14,969 | $229,923 | $90,829 | $139,094 |
| 2019 | $14,441 | $229,533 | $90,675 | $138,858 |
| 2018 | $11,959 | $203,964 | $96,109 | $107,855 |
| 2017 | $12,081 | $203,313 | $95,802 | $107,511 |
| 2016 | $13,561 | $212,125 | $92,179 | $119,946 |
| 2015 | $13,262 | $199,309 | $86,610 | $112,699 |
| 2014 | $11,885 | $159,727 | $87,229 | $72,498 |
| 2012 | $12,129 | $174,390 | $86,460 | $87,930 |
Source: Public Records
Map
Nearby Homes
- 2060 Duffy Ln
- 1890 Robinwood Ln
- 1830 Robinwood Ln
- 2040 Duffy Ln
- 2635 Crestwood Ln
- 2940 Farner Ct
- 11 Warwick Ln
- 8 Royal Ct
- 8 Pheasant Row
- 26 Berkshire Ln
- 1620 Berkeley Ct
- 3115 Duffy Ln
- 7 Court of Fox River Valley
- 2419 Riverwoods Rd
- 1005 Hiawatha Ln
- 1119 Hampton Ct Unit 1
- 1380 Valley Rd
- 6 Robin Hood Ct
- 2260 Congressional Ln
- 11 Lakewood Dr
- 2270 Westcourse Dr
- 1820 Saunders Rd
- 2222 Westcourse Dr
- 2290 Westcourse Dr
- 2290 W Course Dr
- 2267 Westcourse Dr
- 2245 Westcourse Dr
- 2285 Westcourse Dr
- 2300 Westcourse Dr
- 2223 W Course Dr
- 2223 Westcourse Dr
- 2301 Westcourse Dr
- 1830 Saunders Rd
- 2330 Westcourse Dr
- 2323 Westcourse Dr
- 1810 Saunders Rd
- 2201 W Course Dr
- 1920 Saunders Rd
- 1880 Saunders Rd
- 2410 Westcourse Dr