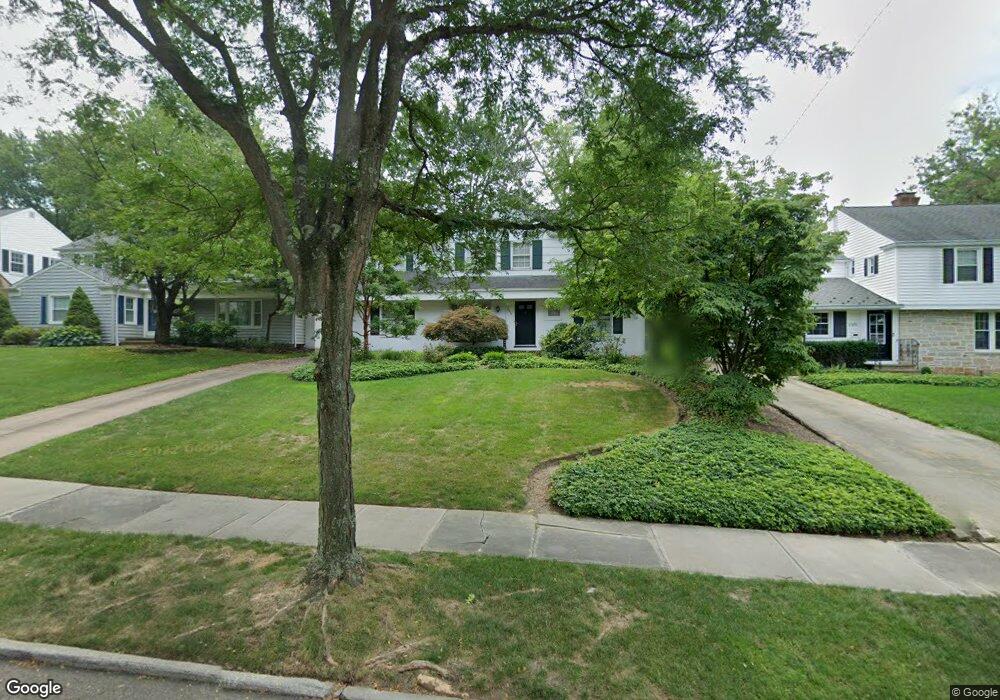
22500 Byron Rd Shaker Heights, OH 44122
Estimated Value: $404,124 - $560,000
4
Beds
3
Baths
2,427
Sq Ft
$196/Sq Ft
Est. Value
About This Home
This home is located at 22500 Byron Rd, Shaker Heights, OH 44122 and is currently estimated at $475,281, approximately $195 per square foot. 22500 Byron Rd is a home located in Cuyahoga County with nearby schools including Mercer Elementary School, Woodbury Elementary School, and Shaker Heights Middle School.
Ownership History
Date
Name
Owned For
Owner Type
Purchase Details
Closed on
Mar 28, 2018
Sold by
Schwgieert Rebecca G
Bought by
Matthew Michael L
Current Estimated Value
Purchase Details
Closed on
Jul 24, 2006
Sold by
Nakamoto Masaru and Nakamoto Chizu
Bought by
Mayhew Michael L and Schweigert Rebecca E
Home Financials for this Owner
Home Financials are based on the most recent Mortgage that was taken out on this home.
Original Mortgage
$248,000
Interest Rate
6.82%
Mortgage Type
Purchase Money Mortgage
Purchase Details
Closed on
Jul 30, 2002
Sold by
Huser Kevin J and Huser Catherine Marcus
Bought by
Nakamoto Masaru and Nakamoto Chizu
Purchase Details
Closed on
Aug 30, 1990
Sold by
Humphrey Margaret M
Bought by
Huser Kevin J
Purchase Details
Closed on
Jul 6, 1984
Sold by
Humphrey David C and M M
Bought by
Humphrey Margaret M
Purchase Details
Closed on
Jan 1, 1975
Bought by
Humphrey David C and M M
Create a Home Valuation Report for This Property
The Home Valuation Report is an in-depth analysis detailing your home's value as well as a comparison with similar homes in the area
Home Values in the Area
Average Home Value in this Area
Purchase History
| Date | Buyer | Sale Price | Title Company |
|---|---|---|---|
| Matthew Michael L | -- | None Available | |
| Mayhew Michael L | $310,000 | Land Amer | |
| Nakamoto Masaru | $305,000 | Midland Title Security Inc | |
| Huser Kevin J | $185,000 | -- | |
| Humphrey Margaret M | -- | -- | |
| Humphrey Margaret M | -- | -- | |
| Humphrey David C | -- | -- |
Source: Public Records
Mortgage History
| Date | Status | Borrower | Loan Amount |
|---|---|---|---|
| Previous Owner | Mayhew Michael L | $248,000 |
Source: Public Records
Tax History Compared to Growth
Tax History
| Year | Tax Paid | Tax Assessment Tax Assessment Total Assessment is a certain percentage of the fair market value that is determined by local assessors to be the total taxable value of land and additions on the property. | Land | Improvement |
|---|---|---|---|---|
| 2024 | $11,602 | $130,060 | $19,845 | $110,215 |
| 2023 | $12,305 | $109,410 | $18,550 | $90,860 |
| 2022 | $11,945 | $109,410 | $18,550 | $90,860 |
| 2021 | $11,904 | $109,410 | $18,550 | $90,860 |
| 2020 | $11,831 | $102,240 | $17,330 | $84,910 |
| 2019 | $11,660 | $292,100 | $49,500 | $242,600 |
| 2018 | $11,751 | $102,240 | $17,330 | $84,910 |
| 2017 | $12,284 | $101,920 | $14,770 | $87,150 |
| 2016 | $11,791 | $101,920 | $14,770 | $87,150 |
| 2015 | $11,124 | $101,920 | $14,770 | $87,150 |
| 2014 | $11,124 | $92,650 | $13,440 | $79,210 |
Source: Public Records
Map
Nearby Homes
- 22275 Rye Rd
- 22625 Rye Rd
- 22600 Canterbury Ln
- 3190 Green Rd
- 22099 Shaker Blvd
- 21262 S Woodland Rd
- 2736 Green Rd
- 23580 Shaker Blvd
- 21120 Sydenham Rd
- 3265 Havel Dr
- 22813 Halburton Rd
- 20962 Sydenham Rd
- 22844 Halburton Rd
- 2680 Wadsworth Rd
- 3180 Somerset Dr
- 22655 Chagrin Blvd Unit 205
- 24255 S Woodland Rd
- 12 Lyman Cir
- 20975 Farnsleigh Rd
- 2678 Rocklyn Rd