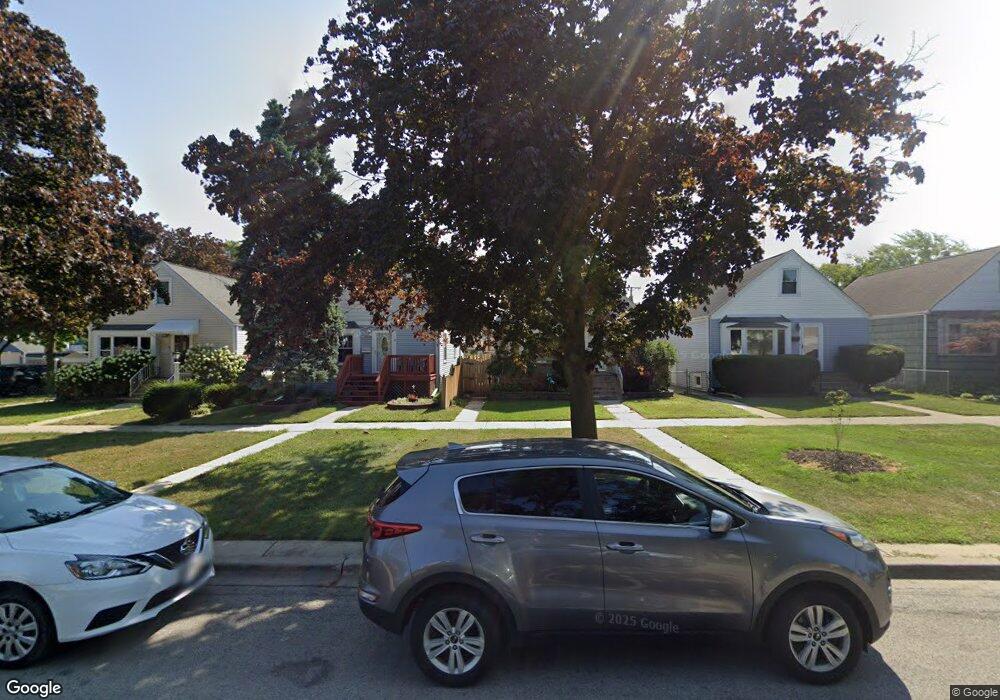
2251 Leyden Ave River Grove, IL 60171
Estimated Value: $342,015 - $386,000
4
Beds
2
Baths
1,224
Sq Ft
$301/Sq Ft
Est. Value
About This Home
This home is located at 2251 Leyden Ave, River Grove, IL 60171 and is currently estimated at $368,254, approximately $300 per square foot. 2251 Leyden Ave is a home located in Cook County with nearby schools including Rhodes Elementary School and East Leyden High School.
Ownership History
Date
Name
Owned For
Owner Type
Purchase Details
Closed on
Jan 31, 2011
Sold by
Olalde Edward L and Olalde Tina
Bought by
Aragon Daniel
Current Estimated Value
Home Financials for this Owner
Home Financials are based on the most recent Mortgage that was taken out on this home.
Original Mortgage
$170,563
Outstanding Balance
$114,415
Interest Rate
4.37%
Mortgage Type
FHA
Estimated Equity
$253,839
Purchase Details
Closed on
Aug 23, 1996
Sold by
Goleba Stanislaw and Goleba Maria
Bought by
Rodriguez Tina and Provenzano Juanita
Home Financials for this Owner
Home Financials are based on the most recent Mortgage that was taken out on this home.
Original Mortgage
$128,130
Interest Rate
8.3%
Mortgage Type
FHA
Purchase Details
Closed on
Jul 14, 1994
Sold by
Kuhr Deborah and Kuhr Philippe
Bought by
Goleba Stanislaw and Goleba Maria
Home Financials for this Owner
Home Financials are based on the most recent Mortgage that was taken out on this home.
Original Mortgage
$109,800
Interest Rate
7%
Create a Home Valuation Report for This Property
The Home Valuation Report is an in-depth analysis detailing your home's value as well as a comparison with similar homes in the area
Home Values in the Area
Average Home Value in this Area
Purchase History
| Date | Buyer | Sale Price | Title Company |
|---|---|---|---|
| Aragon Daniel | $175,000 | Premier Title | |
| Rodriguez Tina | $130,000 | Heritage Title Co | |
| Goleba Stanislaw | $122,000 | Attorneys Natl Title Network |
Source: Public Records
Mortgage History
| Date | Status | Borrower | Loan Amount |
|---|---|---|---|
| Open | Aragon Daniel | $170,563 | |
| Previous Owner | Rodriguez Tina | $128,130 | |
| Previous Owner | Goleba Stanislaw | $109,800 |
Source: Public Records
Tax History Compared to Growth
Tax History
| Year | Tax Paid | Tax Assessment Tax Assessment Total Assessment is a certain percentage of the fair market value that is determined by local assessors to be the total taxable value of land and additions on the property. | Land | Improvement |
|---|---|---|---|---|
| 2024 | $7,565 | $23,869 | $4,019 | $19,850 |
| 2023 | $7,217 | $23,869 | $4,019 | $19,850 |
| 2022 | $7,217 | $23,869 | $4,019 | $19,850 |
| 2021 | $5,604 | $16,920 | $2,871 | $14,049 |
| 2020 | $5,386 | $16,920 | $2,871 | $14,049 |
| 2019 | $5,491 | $19,162 | $2,871 | $16,291 |
| 2018 | $5,528 | $17,726 | $2,488 | $15,238 |
| 2017 | $5,442 | $17,726 | $2,488 | $15,238 |
| 2016 | $5,513 | $18,700 | $2,488 | $16,212 |
| 2015 | $4,422 | $15,115 | $2,201 | $12,914 |
| 2014 | $4,345 | $15,115 | $2,201 | $12,914 |
| 2013 | $6,390 | $19,365 | $2,201 | $17,164 |
Source: Public Records
Map
Nearby Homes
- 8720 Palmer St
- 8715 Ridge St
- 2202 River Rd
- 2449 Leyden Ave
- 2440 River Rd Unit 3E
- 8522 Center St
- 8520 Center St
- 2247 Elm St
- 2436 Spruce St
- 2511 Rhodes Ave
- 2419 Elm St
- 2574 Clarke St
- 2533 Wood St
- 2521 N Thatcher Ave Unit 2i
- 2521 N Thatcher Ave Unit 3A
- 8460 River Grove Ave
- 8631 W Grand Ave Unit 2W
- 8631 W Grand Ave Unit 4W
- 8631 W Grand Ave Unit 4E
- 2078 N 17th Ave
- 2255 Leyden Ave
- 2247 Leyden Ave
- 2259 Leyden Ave
- 2243 Leyden Ave
- 8743 Belden Ave
- 2241 Leyden Ave
- 8741 Belden Ave
- 2239 Leyden Ave
- 8742 Lyndale St
- 8739 Belden Ave
- 2235 Leyden Ave
- 8740 Lyndale St
- 8735 Belden Ave
- 8736 Lyndale St
- 2300 Grove St
- 8731 Belden Ave
- 8734 Lyndale St
- 8727 Belden Ave
- 8732 Lyndale St
- 2304 Grove St