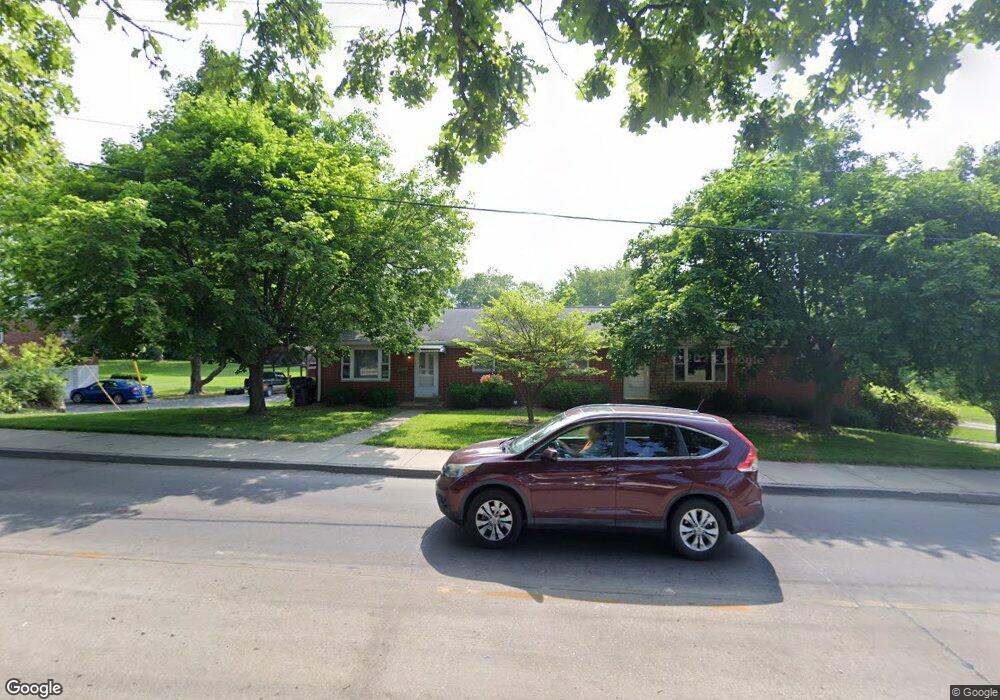
2252 Frank Scott Pkwy W Belleville, IL 62223
Estimated Value: $162,000 - $202,533
--
Bed
--
Bath
2,100
Sq Ft
$86/Sq Ft
Est. Value
About This Home
This home is located at 2252 Frank Scott Pkwy W, Belleville, IL 62223 and is currently estimated at $181,133, approximately $86 per square foot. 2252 Frank Scott Pkwy W is a home located in St. Clair County with nearby schools including Abraham Lincoln Elementary School, West Jr High School, and Our Lady Queen Of Peace Catholic School.
Ownership History
Date
Name
Owned For
Owner Type
Purchase Details
Closed on
Feb 1, 2023
Sold by
J Gough Properties
Bought by
Illinois Llc
Current Estimated Value
Purchase Details
Closed on
May 17, 2021
Sold by
Gough Justin D and Gough Jamie L
Bought by
J Gough Properties Llc
Purchase Details
Closed on
Nov 19, 2020
Sold by
Bruns Bradley J and Bruns Jennifer R
Bought by
Gough Justin and Gough Jamie
Home Financials for this Owner
Home Financials are based on the most recent Mortgage that was taken out on this home.
Original Mortgage
$92,000
Interest Rate
2.8%
Mortgage Type
Commercial
Purchase Details
Closed on
Oct 2, 2015
Sold by
Elbe Verna M
Bought by
Bruns Bradley J and Bruns Jennifer R
Home Financials for this Owner
Home Financials are based on the most recent Mortgage that was taken out on this home.
Original Mortgage
$84,000
Interest Rate
3.91%
Mortgage Type
New Conventional
Create a Home Valuation Report for This Property
The Home Valuation Report is an in-depth analysis detailing your home's value as well as a comparison with similar homes in the area
Home Values in the Area
Average Home Value in this Area
Purchase History
| Date | Buyer | Sale Price | Title Company |
|---|---|---|---|
| Illinois Llc | -- | None Available | |
| J Gough Properties Llc | -- | None Available | |
| Gough Justin | $115,000 | Town & Country Title Co | |
| Bruns Bradley J | $105,000 | Fatic |
Source: Public Records
Mortgage History
| Date | Status | Borrower | Loan Amount |
|---|---|---|---|
| Previous Owner | Gough Justin | $92,000 | |
| Previous Owner | Bruns Bradley J | $84,000 |
Source: Public Records
Tax History Compared to Growth
Tax History
| Year | Tax Paid | Tax Assessment Tax Assessment Total Assessment is a certain percentage of the fair market value that is determined by local assessors to be the total taxable value of land and additions on the property. | Land | Improvement |
|---|---|---|---|---|
| 2024 | $5,010 | $56,971 | $7,422 | $49,549 |
| 2023 | $4,597 | $48,970 | $7,276 | $41,694 |
| 2022 | $4,219 | $44,085 | $6,550 | $37,535 |
| 2021 | $4,063 | $40,755 | $6,055 | $34,700 |
| 2020 | $3,950 | $38,540 | $5,726 | $32,814 |
| 2019 | $4,209 | $40,632 | $5,734 | $34,898 |
| 2018 | $4,116 | $39,753 | $5,610 | $34,143 |
| 2017 | $4,084 | $39,474 | $5,571 | $33,903 |
| 2016 | $4,032 | $38,636 | $5,453 | $33,183 |
| 2014 | $1,765 | $30,086 | $4,061 | $26,025 |
| 2013 | $1,754 | $30,516 | $4,119 | $26,397 |
Source: Public Records
Map
Nearby Homes
- 19 S 56th St
- 44 Gatewood Ct
- 5316 W Main St
- 4720 Ruth St
- 7 S 60th St
- 408 Rosewood Ct
- 2 Winchester Dr
- 317 Southgate Dr
- 4619 Ruth St
- 8 S 51st St
- 22 Terrace Dr
- 4907 W Washington St
- 27 Chadwick Dr
- 30 Brittany Ln
- 2819 Frank Scott Pkwy W
- 102 Kensington Heights Rd
- 125 Barrington Dr
- 69 Country Club Acres
- 324 Penn St
- 102 Kingsway Dr
- 2250 Frank Scott Pkwy W
- 2264 Frank Scott Pkwy W
- 2224 Frank Scott Pkwy W
- 2241 Frank Scott Pkwy W
- 2257 Frank Scott Pkwy W
- 2229 Frank Scott Pkwy W
- 2273 Frank Scott Pkwy W
- 2288 Frank Scott Pkwy W
- 68 Gatewood Ct
- 5 Gatewood Ct
- 72 Gatewood Ct
- 9 Gatewood Ct
- 2209 Frank Scott Pkwy W
- 64 Gatewood Ct
- 130 Willow Creek Rd
- 136 Willow Creek Rd
- 76 Gatewood Ct
- 126 Willow Creek Rd
- 140 Willow Creek Rd
- 124 Willow Creek Rd