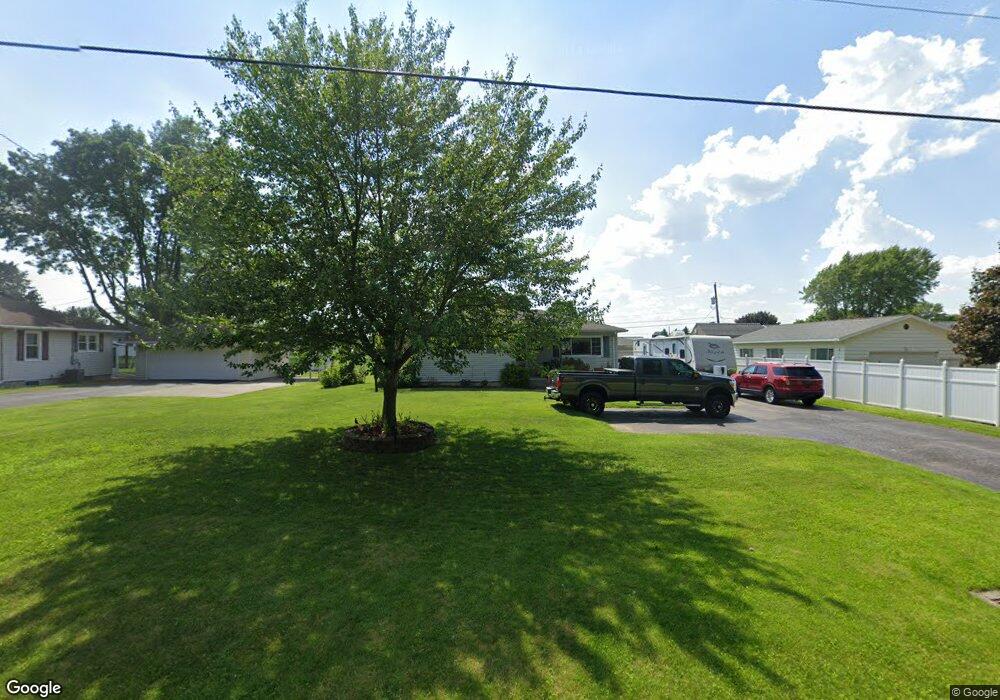
2252 Port Clinton Rd Fremont, OH 43420
Estimated Value: $113,000 - $188,000
3
Beds
1
Bath
942
Sq Ft
$162/Sq Ft
Est. Value
About This Home
This home is located at 2252 Port Clinton Rd, Fremont, OH 43420 and is currently estimated at $152,618, approximately $162 per square foot. 2252 Port Clinton Rd is a home located in Sandusky County with nearby schools including Fremont Ross High School, St. Ann Catholic School, and St. Joseph School.
Ownership History
Date
Name
Owned For
Owner Type
Purchase Details
Closed on
Feb 1, 2013
Sold by
Biller Adam W and Linton Brittnae R
Bought by
Biller Adam W and Biller Brittnae R
Current Estimated Value
Home Financials for this Owner
Home Financials are based on the most recent Mortgage that was taken out on this home.
Original Mortgage
$113,111
Outstanding Balance
$80,731
Interest Rate
3.87%
Mortgage Type
FHA
Estimated Equity
$71,887
Purchase Details
Closed on
Mar 30, 2007
Sold by
Linton Donald P and Linton Sonia L
Bought by
Biller Adam W and Linton Brittnae R
Home Financials for this Owner
Home Financials are based on the most recent Mortgage that was taken out on this home.
Original Mortgage
$122,531
Interest Rate
6.31%
Mortgage Type
Stand Alone Refi Refinance Of Original Loan
Purchase Details
Closed on
Sep 1, 1991
Bought by
Biller Adam W and Biller Brittnae R
Create a Home Valuation Report for This Property
The Home Valuation Report is an in-depth analysis detailing your home's value as well as a comparison with similar homes in the area
Home Values in the Area
Average Home Value in this Area
Purchase History
| Date | Buyer | Sale Price | Title Company |
|---|---|---|---|
| Biller Adam W | -- | Lawyers Title | |
| Biller Adam W | $92,625 | First American | |
| Biller Adam W | $26,300 | -- |
Source: Public Records
Mortgage History
| Date | Status | Borrower | Loan Amount |
|---|---|---|---|
| Open | Biller Adam W | $113,111 | |
| Closed | Biller Adam W | $122,531 |
Source: Public Records
Tax History Compared to Growth
Tax History
| Year | Tax Paid | Tax Assessment Tax Assessment Total Assessment is a certain percentage of the fair market value that is determined by local assessors to be the total taxable value of land and additions on the property. | Land | Improvement |
|---|---|---|---|---|
| 2024 | $3,069 | $46,900 | $10,710 | $36,190 |
| 2023 | $3,069 | $37,530 | $8,580 | $28,950 |
| 2022 | $2,764 | $37,530 | $8,580 | $28,950 |
| 2021 | $1,910 | $37,530 | $8,580 | $28,950 |
| 2020 | $2,498 | $29,270 | $8,580 | $20,690 |
| 2019 | $2,534 | $29,270 | $8,580 | $20,690 |
| 2018 | $2,250 | $29,270 | $8,580 | $20,690 |
| 2017 | $1,963 | $27,380 | $8,580 | $18,800 |
| 2016 | $1,018 | $27,380 | $8,580 | $18,800 |
| 2015 | $1,001 | $27,380 | $8,580 | $18,800 |
| 2014 | $1,050 | $27,340 | $8,330 | $19,010 |
| 2013 | $1,027 | $27,340 | $8,330 | $19,010 |
Source: Public Records
Map
Nearby Homes
- 0 Sean Dr
- Outlot A Sean Dr
- 1730 Port Clinton Rd Unit 41
- 1730 Port Clinton Rd
- 1730 Port Clinton Rd Unit 33
- 711 Bloom Rd
- 2100 Ohio 53
- 2219 Oak Harbor Rd
- 1441 White Ave
- 900 Spring St
- 1227 White Ave
- 711 Rawson Ave
- 612 2nd St
- 1548 North St
- 533 Sandusky Ave Unit 535
- 1720 North St
- 1707 North St
- 433 Sandusky Ave
- 818 Franklin Ave
- 516 N Front St
- 2242 Port Clinton Rd
- 2306 Port Clinton Rd
- 2301 Glenn Dr
- 2234 Port Clinton Rd
- 2309 Glenn Dr
- 2316 Port Clinton Rd
- 2316 Port Clinton Rd
- 2233 Glenn Dr
- 2317 Glenn Dr
- 2248 Glenn Dr
- 2302 Glenn Dr
- 2325 Glenn Dr
- 2325 Glenn Dr
- 2234 Glenn Dr
- 2310 Glenn Dr
- 2224 Port Clinton Rd
- 2318 Glenn Dr
- 2222 Port Clinton Rd
- 2332 Glenn Dr
- 2200 Port Clinton Rd