
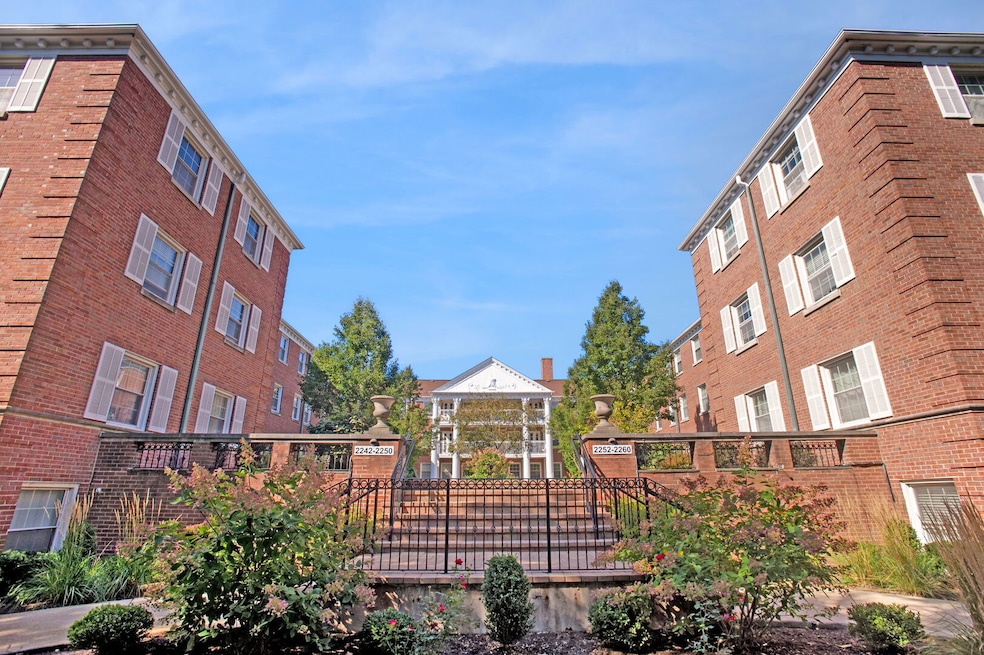

2252 Sherman Ave Unit 2 Evanston, IL 60201
Northeast Evanston NeighborhoodEstimated payment $2,061/month
Total Views
4,982
2
Beds
1
Bath
900
Sq Ft
$267
Price per Sq Ft
Highlights
- Very Popular Property
- 2-minute walk to Noyes Station
- Formal Dining Room
- Orrington Elementary School Rated A
- Wood Flooring
- 3-minute walk to Tallmadge Park
About This Home
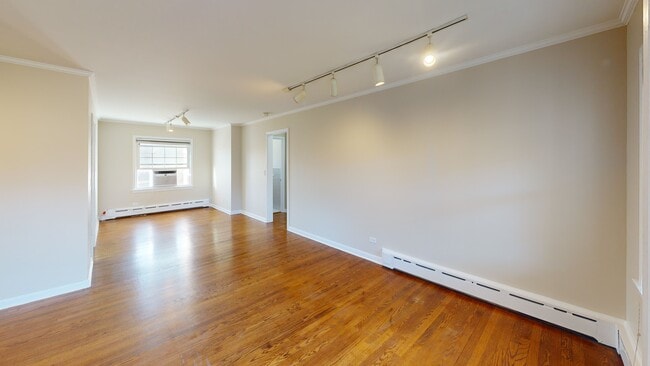
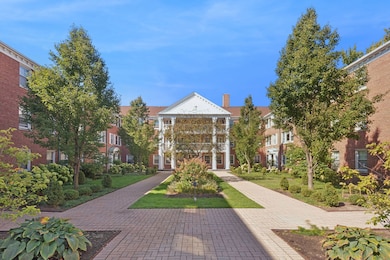
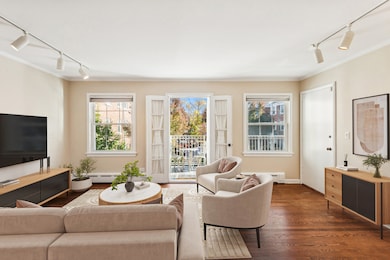
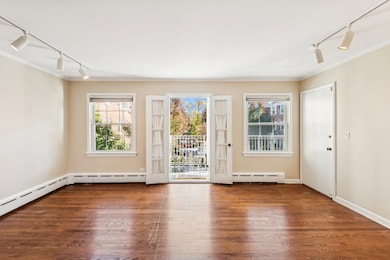
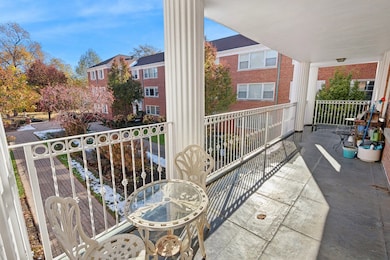
Looking for a condo WITH COVETED GARAGE PARKING SPOT and LOVELY BALCONY in a walkable area near downtown Evanston, Northwestern University, local shops and public transportation? This one is calling your name: A bright 2-bedroom, 1-bath condo blocks from gorgeous Lake Michigan and Evanston hot spots. This second-floor unit is in the center tier of the courtyard building and has gorgeous French doors off of the living room leading to a shared balcony (one of only four units with a balcony!) -- a perfect spot for admiring the manicured courtyard in warmer months. With a separate dining room, two bedrooms and plenty of closet space, you'll love calling this your own. No pets nor rentals allowed in this 100% owner-occupied building. Garage spot included in price. No upcoming special assessments.
Open House Schedule
-
Sunday, November 16, 202511:00 am to 1:00 pm11/16/2025 11:00:00 AM +00:0011/16/2025 1:00:00 PM +00:00Add to Calendar
Property Details
Home Type
- Condominium
Est. Annual Taxes
- $3,645
Year Built
- Built in 1958
HOA Fees
- $493 Monthly HOA Fees
Parking
- 1 Car Garage
- Driveway
- Parking Included in Price
Home Design
- Entry on the 2nd floor
- Brick Exterior Construction
- Concrete Perimeter Foundation
Interior Spaces
- 900 Sq Ft Home
- 3-Story Property
- Window Screens
- French Doors
- Family Room
- Living Room
- Formal Dining Room
- Storage
- Laundry Room
- Home Security System
Kitchen
- Range
- Microwave
- Dishwasher
Flooring
- Wood
- Vinyl
Bedrooms and Bathrooms
- 2 Bedrooms
- 2 Potential Bedrooms
- Mirrored Closets Doors
- 1 Full Bathroom
Outdoor Features
- Balcony
- Courtyard
Schools
- Orrington Elementary School
- Haven Middle School
- Evanston Twp High School
Utilities
- Baseboard Heating
- Heating System Uses Steam
- Heating System Uses Natural Gas
- Cable TV Available
Listing and Financial Details
- Homeowner Tax Exemptions
Community Details
Overview
- Association fees include heat, water, gas, parking, insurance, exterior maintenance, lawn care, scavenger, snow removal
- 34 Units
- Chris Bruno Association, Phone Number (773) 303-7414
- Property managed by Chicagoland Community Management
Amenities
- Common Area
- Coin Laundry
- Community Storage Space
Pet Policy
- No Pets Allowed
Security
- Resident Manager or Management On Site
Matterport 3D Tour
Map
Create a Home Valuation Report for This Property
The Home Valuation Report is an in-depth analysis detailing your home's value as well as a comparison with similar homes in the area
Home Values in the Area
Average Home Value in this Area
Tax History
| Year | Tax Paid | Tax Assessment Tax Assessment Total Assessment is a certain percentage of the fair market value that is determined by local assessors to be the total taxable value of land and additions on the property. | Land | Improvement |
|---|---|---|---|---|
| 2024 | $3,645 | $18,241 | $2,333 | $15,908 |
| 2023 | $3,472 | $18,241 | $2,333 | $15,908 |
| 2022 | $3,472 | $18,241 | $2,333 | $15,908 |
| 2021 | $3,050 | $14,720 | $1,539 | $13,181 |
| 2020 | $3,069 | $14,720 | $1,539 | $13,181 |
| 2019 | $2,994 | $16,099 | $1,539 | $14,560 |
| 2018 | $2,197 | $11,386 | $1,306 | $10,080 |
| 2017 | $2,155 | $11,386 | $1,306 | $10,080 |
| 2016 | $2,267 | $11,386 | $1,306 | $10,080 |
| 2015 | $2,384 | $11,437 | $1,119 | $10,318 |
| 2014 | $2,917 | $13,469 | $1,119 | $12,350 |
| 2013 | $3,842 | $17,326 | $1,119 | $16,207 |
Source: Public Records
Property History
| Date | Event | Price | List to Sale | Price per Sq Ft |
|---|---|---|---|---|
| 11/13/2025 11/13/25 | For Sale | $239,900 | -- | $267 / Sq Ft |
Source: Midwest Real Estate Data (MRED)
Purchase History
| Date | Type | Sale Price | Title Company |
|---|---|---|---|
| Warranty Deed | $191,500 | None Available |
Source: Public Records
Mortgage History
| Date | Status | Loan Amount | Loan Type |
|---|---|---|---|
| Open | $153,000 | New Conventional |
Source: Public Records
About the Listing Agent
Debbie is thrilled to bring her consulting and marketing experience to Coldwell Banker to help you find the home you’ll adore and/or fervently negotiate on your behalf to get top dollar for your house sale! She'll help you understand the current real estate market, carefully listen to your wants and needs and be a trusted advisor. From connecting you with home repair vendors and linking you to neighborhood school information, to assisting with staging your home to get it ready to sell, to
Debbie's Other Listings
Source: Midwest Real Estate Data (MRED)
MLS Number: 12511060
APN: 11-07-115-024-1019
Disclaimer: Certain information contained herein is derived from information provided by parties other than Homes.com. All information provided is deemed reliable, but is not guaranteed to be accurate and should be independently verified.
![]() Based on information submitted to the MLS GRID. All data is obtained from various sources and may not have been verified by broker or MLS GRID. Supplied Open House Information is subject to change without notice. All information should be independently reviewed and verified for accuracy. Properties may or may not be listed by the office/agent presenting the information. Some IDX listings have been excluded from this website.
Based on information submitted to the MLS GRID. All data is obtained from various sources and may not have been verified by broker or MLS GRID. Supplied Open House Information is subject to change without notice. All information should be independently reviewed and verified for accuracy. Properties may or may not be listed by the office/agent presenting the information. Some IDX listings have been excluded from this website.
The Digital Millennium Copyright Act of 1998, 17 U.S.C. § 512 (the “DMCA”) provides recourse for copyright owners who believe that material appearing on the Internet infringes their rights under U.S. copyright law. If you believe in good faith that any content or material made available in connection with our website or services infringes your copyright, you (or your agent) may send us a notice requesting that the content or material be removed, or access to it blocked.
Notices must be sent in writing by email to DMCAnotice@MLSGrid.com.
The DMCA requires that your notice of alleged copyright infringement include the following information:
(1) description of the copyrighted work that is the subject of claimed infringement;
(2) description of the alleged infringing content and information sufficient to permit us to locate the content;
(3) contact information for you, including your address, telephone number and email address;
(4) a statement by you that you have a good faith belief that the content in the manner complained of is not authorized by the copyright owner, or its agent, or by the operation of any law;
(5) a statement by you, signed under penalty of perjury, that the information in the notification is accurate and that you have the authority to enforce the copyrights that are claimed to be infringed; and
(6) a physical or electronic signature of the copyright owner or a person authorized to act on the copyright owner’s behalf. Failure to include all of the above information may result in the delay of the processing of your complaint.
Nearby Homes
- 734 Noyes St Unit 2
- 730 Noyes St Unit K3
- 2252 Orrington Ave
- 2353 Ridge Ave
- 2236 Ridge Ave
- 2125 Sherman Ave
- 2033 Sherman Ave Unit 403
- 2033 Sherman Ave Unit 504
- 2033 Sherman Ave Unit 409
- 2016 Sherman Ave Unit 1E
- 2026 Maple Ave
- 736 Central St
- 2012 Maple Ave
- 1216 Central St Unit 2W
- 1862 Sherman Ave Unit 1NE
- 1864 Sherman Ave Unit 5NW
- 1864 Sherman Ave Unit 3SW
- 1860 Sherman Ave Unit 7NE
- 1889 Maple Ave Unit W10
- 2026 Green Bay Rd
- 2211 Maple Ave Unit 402
- 2353 Ridge Ave
- 1121 Leonard Place Unit 2
- 2129 Ridge Ave
- 2025 Maple Ave
- 637 Library Place Unit 637 Library Place #3
- 627 Library Place
- 829 Foster St
- 721 Foster St Unit 3W
- 1940 Sherman Ave
- 718 Foster St Unit Room
- 714 Foster St Unit 2W
- 1930 Sherman Ave Unit BN
- 1930 Sherman Ave Unit 1N
- 1117 Foster St Unit 1
- 1117 Foster St
- 1117 Foster St
- 1119 Foster St
- 1119 Foster St
- 1119 Foster St