
Landlord's Agent in 2020
Raghava Pallapolu
Fairfax Realty 50/66 LLC
(703) 517-6799
565 Total Sales
Estimated Value: $318,273 - $322,000
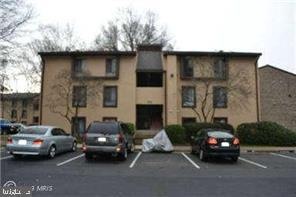
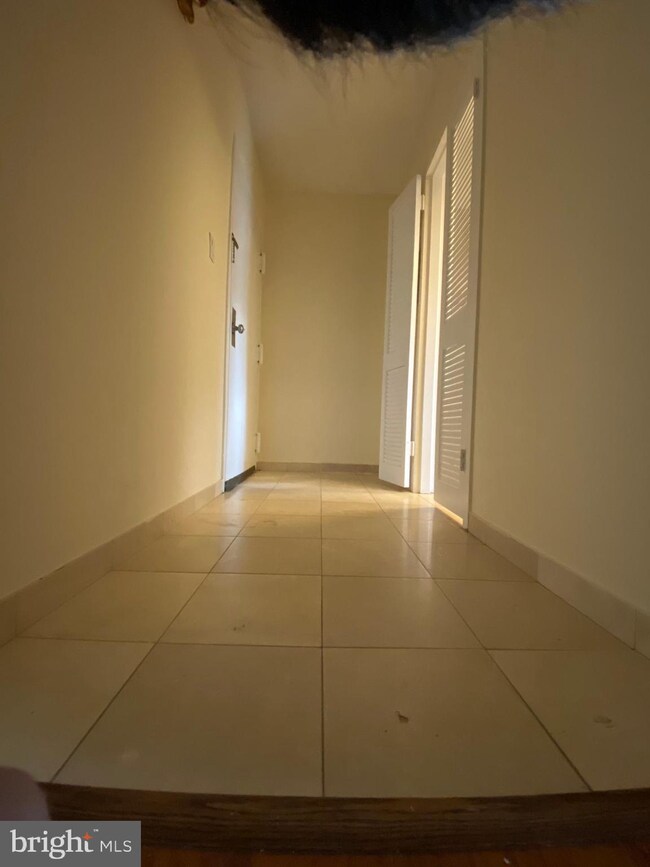
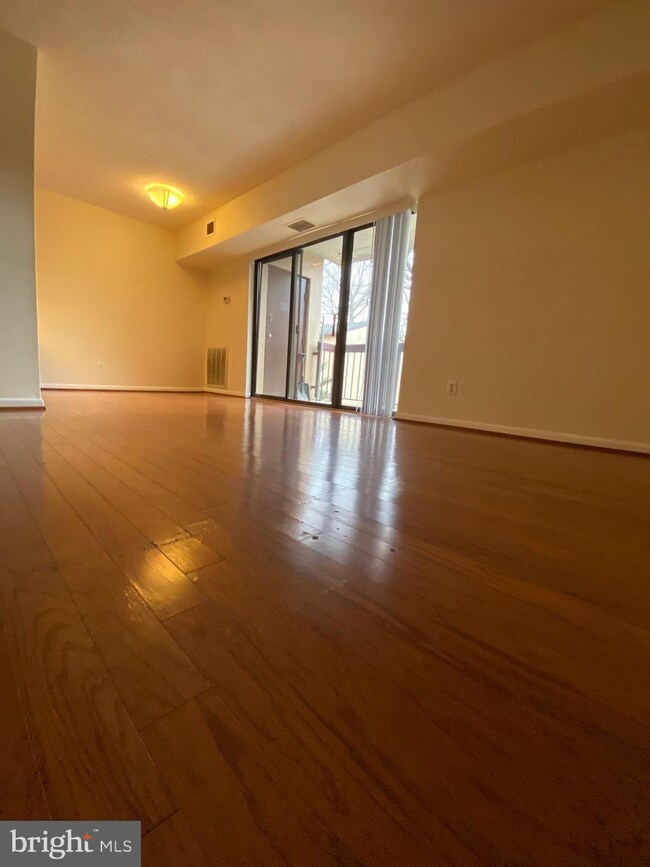
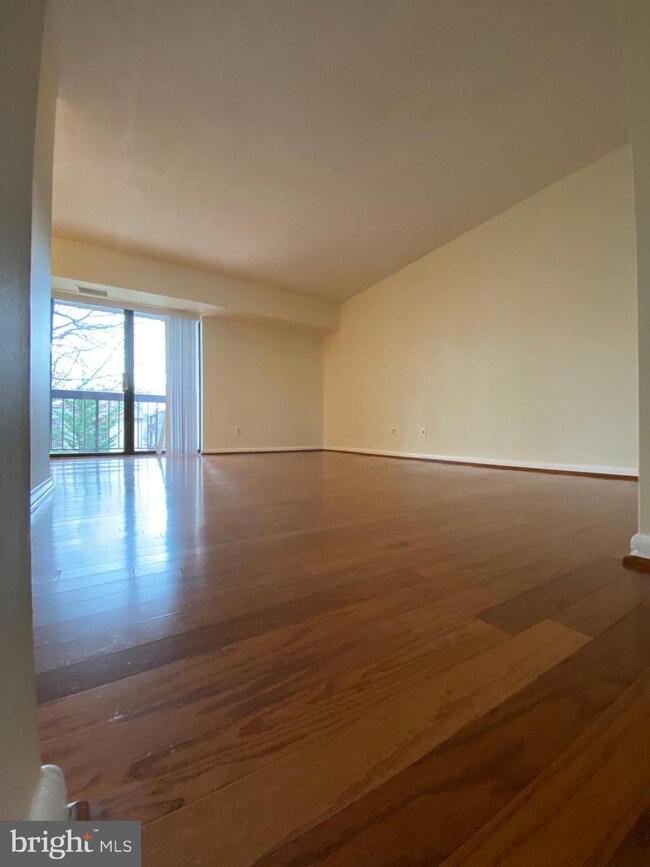
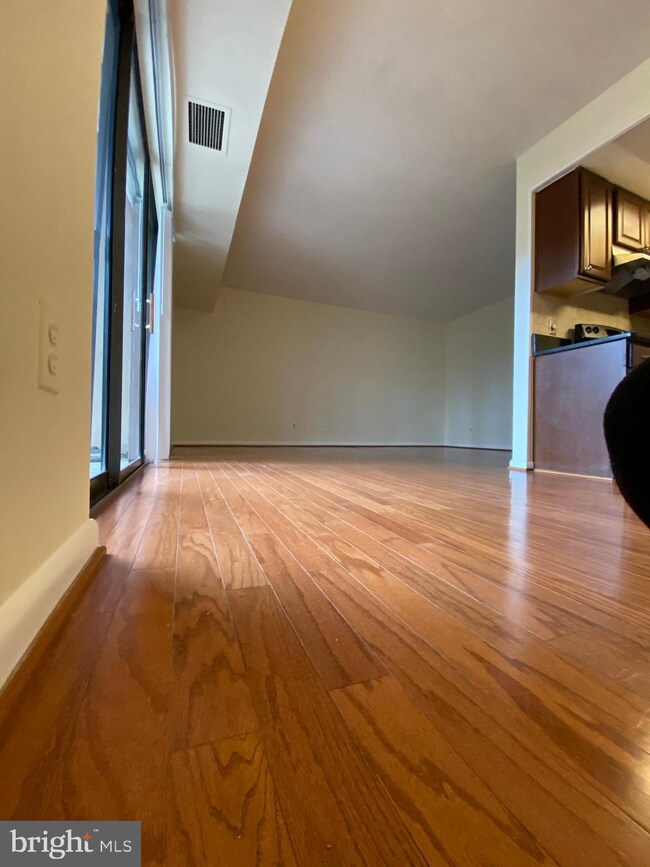
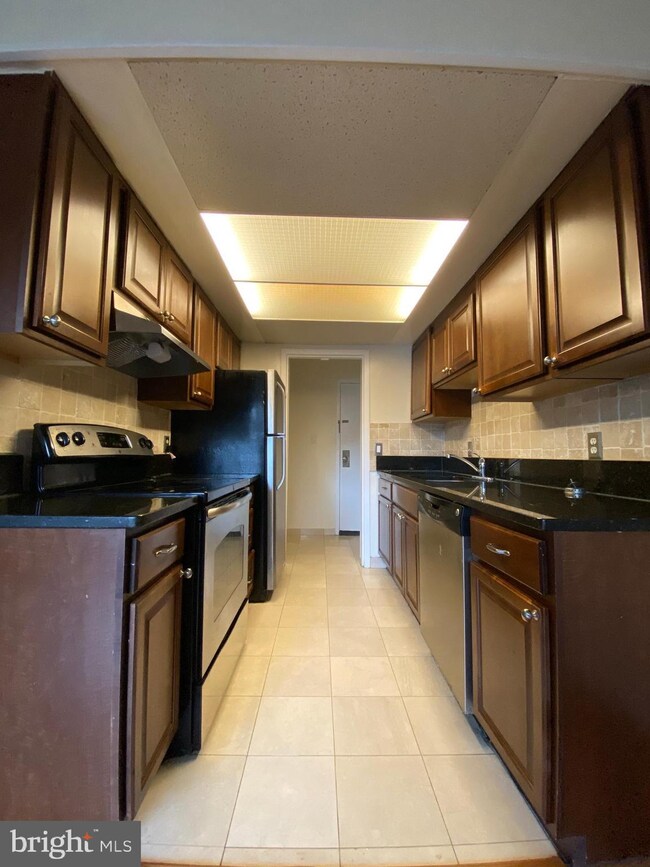
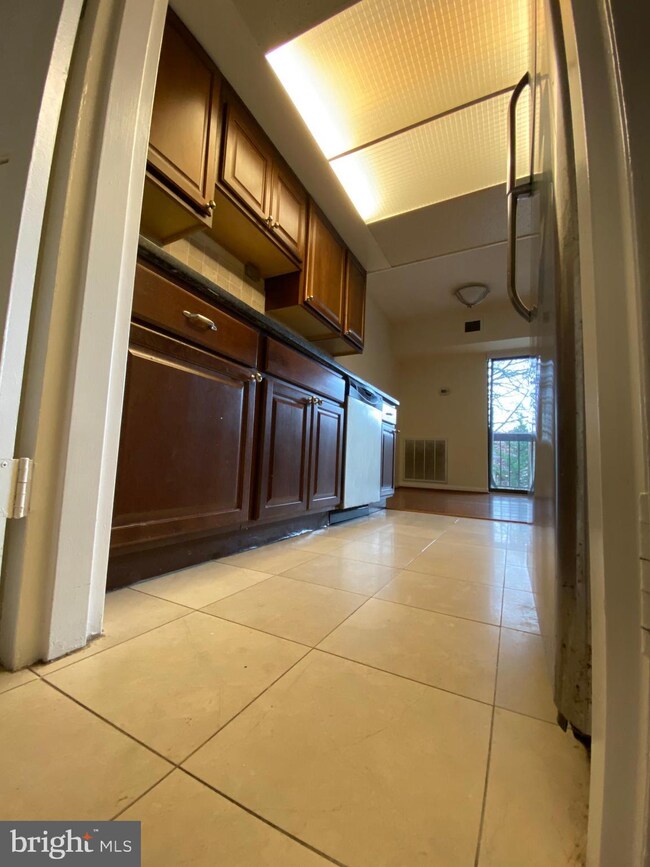
RENT INCLUDES ALL UTILITIES, 3BR,2FB CONDO, GRANITE COUNTERS, ENERGY STAR STAINLESS STEEL APPLIANCES AND MARBLE TILES IN KITCHEN.HWD FLOOR IN LR,DR AND HALLWAY & ALL BEDROOMS.UPGRADED MASTER BATH WITH NEW MARBLE TILE FLOOR. NEW WASHER/DRYER IN UNIT, BALCONY FACES COMMON AREA AND TOT LOT. CLOSE TO RESTON TOWN CENTER, COMMUNITY AMENITIES, TRAILS. GREAT COMMUTE LOCATION. SHOW AND RENT THIS BUITY TODAY
Last Agent to Rent the Property
(703) 517-6799 rpallapolu@yahoo.com Fairfax Realty 50/66 LLC License #0225081466 Listed on: 01/25/2020
Last Renter's Agent
(703) 517-6799 rpallapolu@yahoo.com Fairfax Realty 50/66 LLC License #0225081466 Listed on: 01/25/2020
| Date | Buyer | Sale Price | Title Company |
|---|---|---|---|
| Pallapolu Raghava R | $70,000 | -- | |
| Pallapolu Raghava R | $130,100 | -- | |
| Tutuncu Ekrem | $284,000 | -- |
| Date | Status | Borrower | Loan Amount |
|---|---|---|---|
| Previous Owner | Tutuncu Ekrem | $227,200 |
| Date | Event | Price | List to Sale | Price per Sq Ft |
|---|---|---|---|---|
| 03/01/2020 03/01/20 | Rented | $1,650 | -10.8% | -- |
| 01/25/2020 01/25/20 | For Rent | $1,850 | 0.0% | -- |
| 04/15/2013 04/15/13 | Rented | $1,850 | +8.8% | -- |
| 04/01/2013 04/01/13 | Under Contract | -- | -- | -- |
| 01/09/2013 01/09/13 | For Rent | $1,700 | -- | -- |
| Year | Tax Paid | Tax Assessment Tax Assessment Total Assessment is a certain percentage of the fair market value that is determined by local assessors to be the total taxable value of land and additions on the property. | Land | Improvement |
|---|---|---|---|---|
| 2025 | $3,276 | $271,760 | $54,000 | $217,760 |
| 2024 | $3,276 | $271,760 | $54,000 | $217,760 |
| 2023 | $3,042 | $258,820 | $52,000 | $206,820 |
| 2022 | $2,827 | $237,450 | $47,000 | $190,450 |
| 2021 | $2,635 | $215,860 | $43,000 | $172,860 |
| 2020 | $2,506 | $203,640 | $41,000 | $162,640 |
| 2019 | $2,423 | $196,940 | $37,000 | $159,940 |
| 2018 | $2,117 | $184,060 | $37,000 | $147,060 |
| 2017 | $2,160 | $178,780 | $36,000 | $142,780 |
| 2016 | $2,289 | $189,890 | $38,000 | $151,890 |
| 2015 | $2,254 | $193,770 | $39,000 | $154,770 |
| 2014 | $2,124 | $183,010 | $37,000 | $146,010 |
Landlord's Agent in 2020
Raghava Pallapolu
Fairfax Realty 50/66 LLC
(703) 517-6799
565 Total Sales
Source: Bright MLS
MLS Number: VAFX1105276
APN: 0262-07530012C
Disclaimer: Certain information contained herein is derived from information provided by parties other than Homes.com. All information provided is deemed reliable, but is not guaranteed to be accurate and should be independently verified.
![]() The data relating to real estate for sale on this website appears in part through the BRIGHT Internet Data Exchange program, a voluntary cooperative exchange of property listing data between licensed real estate brokerage firms, and is provided by BRIGHT through a licensing agreement.
The data relating to real estate for sale on this website appears in part through the BRIGHT Internet Data Exchange program, a voluntary cooperative exchange of property listing data between licensed real estate brokerage firms, and is provided by BRIGHT through a licensing agreement.
Listing information is from various brokers who participate in the Bright MLS IDX program and not all listings may be visible on the site.
The property information being provided on or through the website is for the personal, non-commercial use of consumers and such information may not be used for any purpose other than to identify prospective properties consumers may be interested in purchasing.
Some properties which appear for sale on the website may no longer be available because they are for instance, under contract, sold or are no longer being offered for sale.
Property information displayed is deemed reliable but is not guaranteed.
Copyright 2025 Bright MLS, Inc.